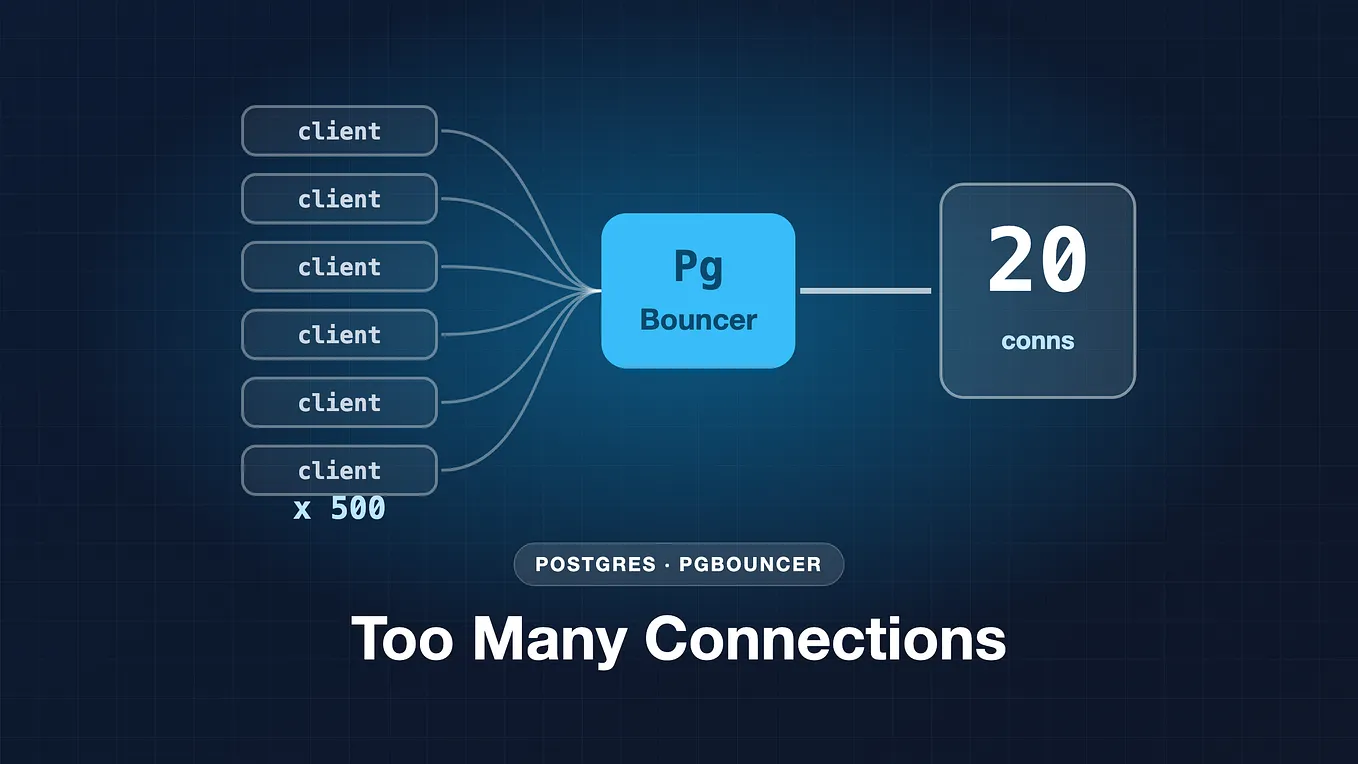
Request 1,001 Failed. CPU Was Idle, the Server Was Fine, and We Were Out of Ports.

A client that opens a new connection per request parks every port in TIME_WAIT for a minute. With 1,000 ports, request 1,001 failed in under 0.2 seconds.

The incident where everything looked healthy
The incident below is fictional and illustrative. The measurements come from a small Python reproduction I ran on a shared Linux VM, inside a throwaway network namespace.
A team moves a month-end batch job onto a sidecar that calls an internal API through a single virtual IP. The job’s HTTP client opens a new connection for every call and closes it when the response arrives. At peak, a slice of calls starts failing within seconds with “Cannot assign requested address.” The API’s dashboards are green, its CPU is idle, and a minute after the job backs off, the errors disappear on their own.
The server team gets paged and finds nothing, because there is nothing to find on the server. The failure lives on the client, in a resource most of us never think of as finite: local ports. When I reproduced it with a deliberately small port range of 1,000 ports, the first 1,000 requests succeeded and request 1,001 failed. Every run.
The naive model: ports are plentiful and TIME_WAIT is the server’s problem
The comfortable belief goes like this. A machine has about 65,000 ports, a connection uses one briefly, and when it closes the port goes back into the pool. If anything piles up in TIME_WAIT, surely that is the server’s concern, since servers handle the most connections.
All three parts of that are shaky. Linux hands out outbound ports from ip_local_port_range, which by default is 32768 to 60999. That is 28,232 ports, not 65,000. And TIME_WAIT is held by whichever side closes the connection first, which for a client that hangs up after reading a response is the client.
The part that turns this into an incident is duration. On Linux, a socket in TIME_WAIT keeps its slot for 60 seconds. That length is fixed in the kernel, and it is not what tcp_fin_timeout controls, despite the name; that setting governs FIN_WAIT_2.
Production reality: a budget per destination, leased for a minute
A TCP connection is identified by four values: source IP, source port, destination IP, destination port. If your client has one IP and talks to one destination IP and port, only the source port can vary. So the number of connections you can have open or in TIME_WAIT toward that destination is capped by the size of the port range.
That turns “new connection per request” into a rate limit. With the default range and a 60-second TIME_WAIT, the arithmetic is 28,232 divided by 60, about 470 new connections per second toward one destination. Widening the range to 1024 through 65535 gives 64,512 ports, about 1,075 per second. These are calculated budgets, not measurements, and real limits can be lower if other sockets share the range.
This is why the failure is a cliff rather than a slope. Everything works until the last free port is leased, then every new connect fails instantly. It also explains the self-healing: as TIME_WAIT entries expire after a minute, ports come back, and the “blip” ends.
Reproducing it in 0.15 seconds
To make the cliff visible without touching the host, each case ran in a fresh network namespace, where these sysctls are per-namespace. The script sets the port range to 40000 through 40999 and picks a tcp_tw_reuse value. The host's own settings read 32768 60999 and tcp_tw_reuse=2 before and after.
ip link set lo up
echo "40000 40999" > /proc/sys/net/ipv4/ip_local_port_range   # 1000 ports
echo "$2" > /proc/sys/net/ipv4/tcp_tw_reuse
The client loop is the pattern from the incident: connect, send, read the reply, close. Because the client closes first, the client socket lands in TIME_WAIT.
s = socket.create_connection((HOST, PORT), timeout=2)
            s.sendall(b"GET\n"); s.recv(8); s.close()
Here is one run of 3,000 requests against a local server on the loopback interface. The first line is the namespace’s settings; the second is the result.
# range=40000	40999 tw_reuse=0 fin_timeout=60 kernel=6.12.94+
{"mode": "newconn", "requests": 3000, "ok": 1000, "errors": 2000, "errors_by_errno": {"EADDRNOTAVAIL": 2000}, "first_error_at_request": 1001, "first_error_after_s": 0.144, "time_wait_at_first_error": 1000, "time_wait_at_end": 1000, "elapsed_s": 0.234, "errors_per_s": 8541.1}
(Excerpt from runs.log: round 1 of three, section header line omitted.)
In all three rounds, 1,000 requests succeeded and 2,000 failed with EADDRNOTAVAIL. The first failure was request 1,001, after about 0.15 seconds, with exactly 1,000 sockets in TIME_WAIT. When I reran everything before writing this, the result was identical in count and position, with the first error arriving at 0.17 to 0.19 seconds on a busier VM.
Notice the error rate after exhaustion: thousands of failures per second. A connect that fails for lack of a port never leaves the machine, so it fails fast. If a caller retries on error, those instant failures can feed a retry loop that looks far worse than the original problem.
The sysctl everyone reaches for
The usual first response is tcp_tw_reuse. In my runs, the Linux default of 2, which enables reuse for loopback traffic only, behaved exactly like 0, even though the test ran on loopback: 1,000 OK and the first error at request 1,001, three times out of three.
Setting it to 1 is where the results got murky. In the original runs it partly helped, with 1,857, 1,583 and 1,082 successes before the first error. In my rerun on the same VM, it made no difference at all: 1,000 OK and failure at request 1,001 in all three rounds.
I did not isolate why. Reuse depends on TCP timestamps and on the kernel judging reuse safe, so treat these numbers as “variable on this box,” not as evidence it fixes or fails to fix exhaustion in general.
Get Kevin Tung’s stories in your inbox
Join Medium for free to get updates from this writer.
Its older sibling, tcp_tw_recycle, is not an option. It was removed in Linux 4.12 after it broke clients behind NAT.
Implementation: fix the connection pattern, then add headroom
The measured fix is to stop spending a port per request. With one keep-alive connection reused for all 3,000 requests, every round had 3,000 OK, zero errors and zero sockets in TIME_WAIT at the end.
{"mode": "pooled", "requests": 3000, "ok": 3000, "errors": 0, "errors_by_errno": {}, "first_error_at_request": null, "first_error_after_s": null, "time_wait_at_first_error": null, "time_wait_at_end": 0, "elapsed_s": 0.047, "errors_per_s": 0.0}(Excerpt from runs.log, round 1.)
It was also faster: about 0.05 seconds for all 3,000 requests, against about 0.15 seconds for just the first 1,000 new connections. I wrote about the latency side of connection reuse in a post about curl -w timings; this is the failure side of the same habit. Here are the options I would weigh, with their costs.
- Connection pooling and keep-alive. Removes the per-request port burn at the source. The costs are pool sizing, handling stale connections, uneven load balancing when connections are long-lived, and idle timeouts that must sit below the server’s and load balancer’s.
- Let the server close first. Moves TIME_WAIT to the server, where it is spread across many clients. This is a protocol or server change, and the server now holds that state.
- More destination IPs or ports, or more source IPs. Each extra tuple dimension multiplies the budget. It adds operational complexity, and NAT gateways may need more addresses.
- Widen the port range. Roughly 2.3x headroom by the arithmetic above. It can collide with ports that services listen on, and it buys time rather than fixing anything.
- SO_LINGER with zero timeout. Sends a reset on close and skips TIME_WAIT. It can drop in-flight data and lets delayed segments hit a new connection, so it is a last resort, not a routine fix.
In practice, the fix is usually one shared client per process instead of one per call. That means reusing a single Go http.Client and draining response bodies, using a Python requests.Session, or enabling keepAlive on a Node agent. Check that the library actually reuses connections under your traffic, because an undrained body or a per-request client silently disables it.
Watching for it before it pages you
Monitoring this is cheap once you know to look on the client. ss -s reports the TIME_WAIT count, and you can count TIME_WAIT sockets toward one destination with a filter on the destination port. A sketch, not run as part of this reproduction:
ss -s
ss -tan state time-wait '( dport = :443 )' | wc -l
Alert on client-side connect failures broken out by errno, EADDRNOTAVAIL and EADDRINUSE in particular, not just on HTTP 5xx. Then track the new-connection rate per destination against its calculated budget and set an alert well before you reach it.
The recovery behavior is also a useful diagnostic. In the same namespace, I exhausted the range, waited 61 seconds and tried again. The second attempt got another 1,000 successes before the next EADDRNOTAVAIL, in the original log and in my rerun, which is consistent with a 60-second TIME_WAIT.
Where the budget collapses
The per-destination math gets worse in exactly the places modern systems like. A NAT gateway collapses many pods onto one source IP. A virtual IP or a sidecar on localhost collapses many backends into one destination. In both cases, adding servers behind the VIP does not grow the tuple space the client draws from.
Cloud NAT gateways also have their own per-destination port limits. I did not test one, so check your provider’s documentation rather than trusting a number from a blog post, including this one.
Caveats on these numbers
- This was loopback traffic inside a network namespace on a shared VM, with a Python client, a deliberately tiny 1,000-port range and kernel 6.12.94. Absolute timings and error rates will differ on real networks and real hardware.
- The
tcp_tw_reuseresults are not explained. Setting 1 helped partly in one set of runs and not at all in the rerun, and setting 2 did not help on loopback in either. - No NAT or cloud gateway was tested.
- The month-end batch incident is fictional. The reproduction and its logs are real.
Rules of thumb
- Instant client-side errors that heal in about a minute point at TIME_WAIT. Check the client’s ports before you page the server team.
- New connection per request is a capacity number. Divide usable ports by 60 for each destination, and count tuples, not servers.
- Sysctls are a tourniquet; pooling is the cure. Reuse connections first, then add headroom if you still need it.
Your turn
In this reproduction, a healthy server and an idle CPU did not stop request 1,001 from failing. They just pointed everyone in the wrong direction. Where in your stack do many callers collapse onto one source IP or one destination, and would your client metrics tell you it was happening?