The N+1 Query and Other Silent Killers: Why Your App Is Fast With 10 Records and Slow With 10,000


The records office
You send an assistant to the records office to collect the details of 100 customers. The first assistant walks to the office, gets one customer’s file, walks back, and repeats this 100 times. The second assistant takes a list of all 100 names, makes one trip, and returns with a folder.
Both finish the job. One loses the whole afternoon walking.
What N+1 means
Most applications hire the first assistant by accident. Here is the pattern in plain pseudo code:
orders = db.query(“SELECT * FROM orders LIMIT 100”) # 1 query
for order in orders:
customer = db.query(
“SELECT * FROM customers WHERE id = ?”, order.customer_id) # 100 more queries
show(order, customer.name)
That is 1 query to get the list, plus N queries, one for each item, so N+1. With 10 test orders, it runs 11 queries and feels instant. With 10,000 orders, it runs 10,001.
The fix has the same shape as the second assistant
orders = db.query(“SELECT * FROM orders LIMIT 100”) # 1 query
ids = unique(order.customer_id for order in orders)
customers = db.query(“SELECT * FROM customers WHERE id IN (…)”, ids) # 1 query
# or fetch both at once with a single JOIN
Two queries, no matter how many orders.
The surprise is that your slow query log will not catch it
This is what makes N+1 so dangerous. Every query in the loop is fast, often a millisecond or two, so none of them is flagged as slow. The database looks healthy, and every individual query looks innocent. The problem is the number of queries, and the time spent on round trips between your app and the database.
It also hides well:
1. In tests. Test databases hold a handful of rows, so the loop is invisible.
2. In ORM code. Many ORMs load related data lazily, on first access, so a harmless-looking line like order.customer.name quietly triggers a query.
3. In views and serializers. The loop is often not in your business logic. It is in a template or an API response formatter that reads a relationship for each item.
4. In GraphQL. A resolver for a field runs once per item in a list, which is the same trap in different clothes.
Get Rufus Kehinde’s stories in your inbox
Join Medium for free to get updates from this writer.
The 5-minute count test
1. Pick one busy page or endpoint.
2. Turn on query logging, or use a helper tool, and count how many queries a single request makes.
3. Run the same request with 10 records, then 100. If the count grows with the data, you have found an N+1.
4. Or ask the database directly. In PostgreSQL, enable pg_stat_statements and sort by calls. In MySQL, use the performance schema’s statement digest tables. A simple query with a very large call count is a prime suspect.
If you find a request making more than a few dozen queries, you have a good chance of finding something to fix.
The fixes from simplest to most structural
- Eager loading with a join. Ask for the related data in the same query.
- Batch loading. Fetch the parent rows, then fetch all related rows in one query using a list of IDs. This avoids a JOIN’s row multiplication.
- Request level batching for GraphQL. A DataLoader style helper collects all the lookups made while resolving one request and runs them as a single batched query.
- Cache small, stable reference data such as country lists or categories, so you do not query them at all.
- Reshape the data. Sometimes a precomputed summary or a small amount of denormalization removes the need for the extra lookups.
- Add guardrails so it cannot return. More on that below.
In your stack, these are examples of how each ecosystem solves the same problem. Check the documentation for your version:
- Django: select_related and prefetch_related, and assertNumQueries in tests
- Laravel: with() for eager loading, and preventLazyLoading() to make lazy loading throw an error in development
- Rails: includes, and the Bullet gem to flag N+1 patterns
- Java with Hibernate or JPA: JOIN FETCH, entity graphs, @BatchSize, and Hibernate’s statistics
- .NET with EF Core: Include, split queries with AsSplitQuery, and query logging
- Node.js: Prisma’s include and select, TypeORM relations or query builder joins, Sequelize include
- GraphQL on any server: DataLoader or an equivalent batching library
Other silent killers that look like this
- Selecting everything. Fetching all columns when you need two wastes memory, bandwidth, and sometimes prevents the database from using an efficient index-only read.
- Unbounded queries. A query without a limit works well until the table grows; then it returns millions of rows.
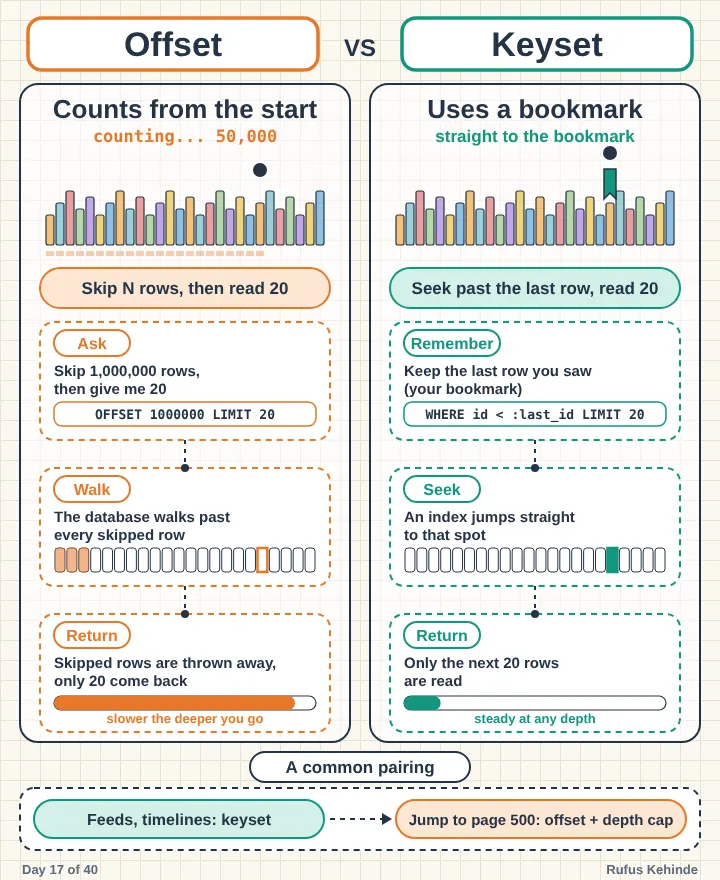
- Deep offset pagination. Asking for page 50,000 with OFFSET makes the database find and discard all the earlier rows first. Cursor, or keyset, pagination avoids that by continuing from the last item seen.
- Counting by loading. Loading every row into memory to count them, when the database can count in one query.
- N+1 over the network. The same pattern between services: one call to get a list, then one HTTP call per item. It is the same trap with a much higher price per trip.
- Long transactions. Holding a transaction open while doing slow work keeps locks and connections busy. We return to this in later database days.
Put guardrails in place
Fixing one N+1 is good. Making sure it cannot return is better.
- Set a query budget per endpoint, and fail the build if a test request exceeds it.
- Use development warnings where your framework offers them, so lazy loading in a loop is flagged immediately.
- Test with realistic volumes. A handful of rows hides everything.
- Track queries per request as a metric in production, and review your most called and most expensive queries regularly.
The scale lens
- Queries per second multiply. A page that makes 101 queries, viewed 1,000 times per second, sends 101,000 queries per second to the database. Two queries instead of 101 means 2,000 per second, which is 50 times less load for the same page. (Illustrative numbers, but the multiplication is real.)
- Tail latency compounds. If each query is slow only 1% of the time, a page that makes 101 queries has about a 64% chance of hitting at least one slow query. A page with 2 queries has about a 2% chance.
- Connection pools run dry. Each in-flight request holds a database connection while it runs its queries. A chatty page holds it much longer, so you run out of connections far earlier.
- Read replicas spread the pain; they do not cure it. Sending the extra queries to a replica reduces load on the primary, but the waste is still there, and you pay for it.
- Cost. Database capacity is usually the most expensive thing to scale, so fewer queries is real money.
A security note
- Do not log sensitive query parameters in production. Query logs can capture personal data, tokens, and other secrets. Use them in development, and be careful with sampling and redaction elsewhere.
- Limit page sizes. An API that lets a caller request any number of items can be abused to exhaust your database. Enforce a maximum.
- Scope batching per request. A DataLoader style cache that is shared between users can leak one person’s data to another. Create it per request.
- Keep your filters in batched queries. When you batch lookups, make sure ownership and tenant checks still apply, or a convenient optimization becomes a data leak.
- Select only what you need. Over-fetching and then serializing whole related objects can expose fields you never meant to send. This maps to the excessive data exposure risks in the OWASP API Security list.
The tradeoffs
- Joins can multiply rows. Eagerly loading several one-to-many relationships at once can return a huge, repeated result set, so split the query in that case.
- Very long IN lists can hit limits or hurt performance, so process IDs in chunks.
- Eager loading everywhere is over-fetching. Lazy loading is sometimes the right choice, such as for a rarely used relationship on a single record.
- Batching helpers add a layer of abstraction that the team must understand.
- Caching reference data adds the staleness problem.
Tools to start with
- Your framework’s query debug tools, such as the ones listed above
- Database statistics: pg_stat_statements in PostgreSQL, the performance schema in MySQL
- The database’s slow query log, for the opposite problem, individually slow queries
- Distributed tracing, which shows the repeated query spans inside one request
- Tests that assert on query counts
An ORM makes it easy to write slow code that looks clean. Count your queries the way you count your money.