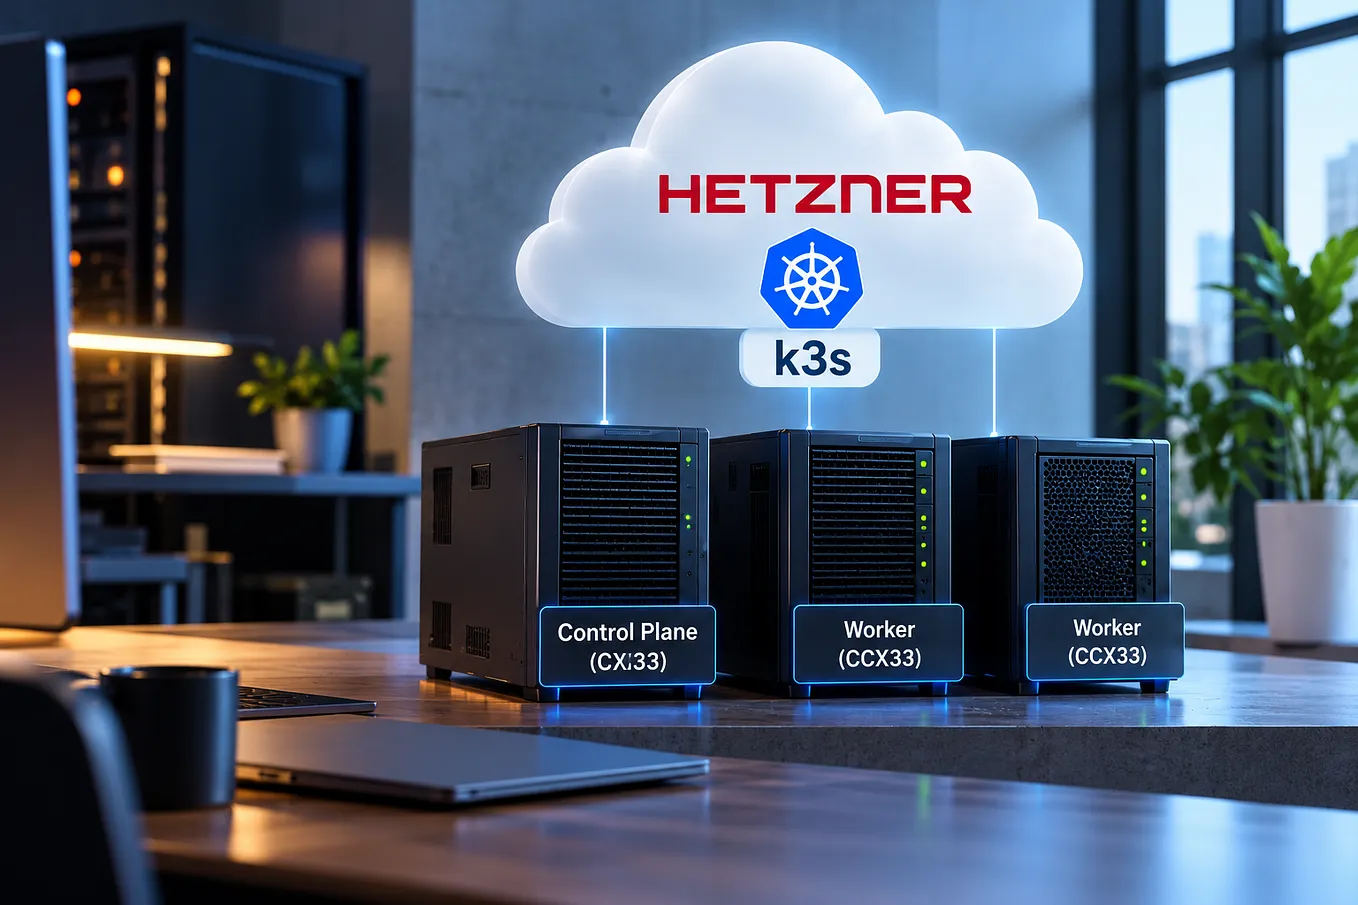
My ten node K3s homelab: PXE installs and power efficient cluster
PXE installs, Wake-on-LAN, and the checks I needed before letting machines turn themselves off.

I wanted a homelab that could host applications and eventually run private CI jobs without leaving every machine powered on all day. I had ten small computers to work with. Installing Ubuntu on each one was the first job. Deciding when it was safe to turn one off became the more interesting part.
The setup described here reflects my September 2026 build: ten Ubuntu Server nodes running K3s, a separate management machine, internal ingress, monitoring, and a conservative power controller. GitHub runners are still planned. So are public hosting and the storage setup for persistent applications.
Seven workers can sleep when they are empty and not running any pods. The control plane, two application workers, and the management host stay on. That leaves four computers running at the minimum, before counting the firewall and networking equipment.
The cluster has three jobs
I split the ten cluster nodes into three pools. One runs the K3s control plane with embedded etcd. Two are the always-on application pool. The remaining seven are reserved for future CI workloads and are eligible for power management.
The machines each reported 12 logical CPUs and roughly 16 GB of RAM and roughly 15 GB of usable RAM. Those are scheduling resources, not twelve physical cores per machine. I still need real build measurements before deciding how many jobs to pack onto each worker.

The management host sits outside Kubernetes. It runs Ansible, collects recovery archives, sends Wake-on-LAN packets, and hosts Prometheus, Grafana, and the power controller. It also retains the PXE installation files.
Keeping that machine separate means the hardware controller stays available when every elastic worker is asleep. It also gives me somewhere to work from when the cluster needs recovery.
OPNsense provides DHCP and the firewall boundary on a separate physical node network. Traffic from that network to the main LAN is blocked; outbound Internet access is allowed. I am leaving addresses and device identifiers out of the diagrams because they add nothing to the explanation.
I started with one control-plane node. That is a real availability compromise: losing it stops scheduling and cluster management. Two application workers and two ingress replicas do not fix that. Existing workloads may keep running, but I would still need to restore the server to regain control.
PXE solved the repeated installation work
For the operating system, I used UEFI PXE boot and Ubuntu Server autoinstall. OPNsense supplies DHCP and boot information. The management host serves the boot files through TFTP and the installer image and NoCloud configuration through HTTP.
GRUB maps a known client MAC address to that machine’s seed directory. Each seed supplies the installation settings, including the hostname, storage configuration, and SSH setup. An unknown device stops at an inventory message rather than receiving a default installation.

That MAC check is a guard against an accidental reinstall. It is not device authentication. A recognized machine can still have its selected disk erased by autoinstall, so choosing network boot remains an intentional maintenance action.
Once the machines were installed, I disabled the PXE services and returned them to normal disk boot. The files are still there when I need them. I would rather explicitly enable provisioning for a repair than leave an unattended installer waiting behind every reboot.
There is also a limit to what installation automation can solve. If the installer cannot see an internal drive, more YAML will not make one appear. Storage detection, firmware settings, and the intended target disk need checking before an unattended install is useful. Canonical’s autoinstall quick start explains the NoCloud configuration mechanism.
K3s and internal ingress came next
I had an earlier kubeadm plan, but the deployed cluster uses K3s. All ten nodes were verified Ready during the September build. The network uses Flannel VXLAN and the K3s network-policy controller. Cluster DNS and metrics-server run on the application workers.
For ingress, I installed MetalLB in Layer 2 mode and Traefik with one replica on each application worker. The test covered cross-node traffic, DNS, an allowed and a denied network-policy path, and HTTP routing through ingress. An unknown hostname returned the expected 404.
That gave me an internal route to applications. Public DNS, trusted TLS, and WAN forwarding are not configured. I also have not tested ingress failover by switching off an application worker.
The elastic pool has labels and a CI taint to keep ordinary application pods away. These are Kubernetes scheduling controls. They do not make a shared host safe for hostile build jobs. Runner credentials, repository access, and job isolation need their own design before I register any runners.
Low CPU use does not mean a machine is empty
A worker can have almost no CPU activity while holding an idle runner, a pod waiting on the network, or data another workload needs. I did not want shutdown decisions based on utilization.
Get Ashish J’s stories in your inbox
Join Medium for free to get updates from this writer.
The controller’s first version uses complete emptiness. Every pod blocks shutdown, including completed pods, terminating pods, and DaemonSets. Storage attachments and local or node-affined volumes also block it conservatively. Finished Job pods have to be cleaned up before their worker can sleep.
This controller does not evict workloads or drain a busy node. It waits for the node to become empty, then cordons it to stop new scheduling. That makes the first implementation less ambitious, but the shutdown decision is easier to inspect.

Before a worker can sleep, the controller requires at least ten minutes of observed uptime and ten minutes continuously empty. It checks node identity, fresh health information, the protected nodes, and any maintenance holds. A restart or API error resets the observation grace period.
It waits another 30 seconds and checks again. New work cancels the shutdown. A restricted helper on the worker independently checks for remaining container sandboxes and repeats that check immediately before clean power-off.
Waking follows a different path. An eligible pending pod must remain unplaced for 30 seconds and need capacity beyond the ready CI workers. The controller wakes one sleeping machine, waits for a new boot identity and fresh readiness, checks the worker, and clears only the cordon it owns.
The supported wake workload is deliberately narrow. It needs the expected pool selector, toleration, label, and explicit CPU, memory, and temporary-storage requests. Complex scheduling rules and storage-dependent jobs are not supported by this version. A pending pod is not automatically a reason to boot more hardware.
Shutdown and wake timeouts produce a persistent fault for investigation. Manual holds and cordons are respected. The controller has restricted Kubernetes access and a separate power-only SSH key, rather than the administrator’s credentials.
I observed shutdowns and demand-driven wakes during the September build. The controller also passed 30 tests. I still need to test scaling under real CI traffic and measure power savings and job-start latency.
GitHub runners will add another scaling loop
The plan is to use GitHub’s Actions Runner Controller for ephemeral runners. ARC would create runner pods in response to jobs. My external controller would supply physical capacity when supported pods cannot fit on the ready workers.
That connection is not installed today. A job waiting in GitHub does not currently wake a machine. Real ARC integration needs to prove that the runner pods meet the controller’s workload contract and that their cleanup lets workers become empty again.
I will start with a small allowlist of private repositories and measured job sizes. Private repositories still execute dependencies and Actions, so that label alone does not make their jobs trustworthy.
Monitoring caught a boot problem before the load test
Prometheus collects node metrics and controller state. Grafana shows CPU use, available temperature sensors, memory, disk usage, readiness, and the sleep/wake timeline. Monitoring runs on the management host, with native exporters on the workers.

The dashboard distinguishes expected sleep from unexplained unreachability. Calling a machine asleep requires fresh controller intent as well as a failed scrape. If telemetry is stale, the state becomes unknown. A gap in a temperature graph means there was no sample, not that the machine reached zero degrees.
During load-test preparation, several workers woke and became Kubernetes Ready, but their exporters did not recover. The exporters had tried to bind their reserved addresses before DHCP completed, then exhausted systemd’s rapid restart limit.
The repair added network-online ordering and slower restart attempts while retaining the access filter. All eleven scrape targets recovered. A later reboot still needed to verify that repair through the full boot sequence, so I would not call the startup issue fully closed from the recovered scrapes alone.
The five-minute thermal test stopped early
On September 21, I ran a CPU workload across all ten cluster nodes. Each reached roughly 100 percent CPU. The intended duration was five minutes, but about a minute and a half into the native workload, one node crossed the test’s conservative 90 C threshold and cleanup started.
The highest observed temperature, including the termination window, was about 92.8 C. That threshold was my test policy, not a verified limit.
An earlier Python workload had also hit a worker segfault on another node. The native retry did not produce another matching kernel error, but that does not explain away the earlier crash.
Recovery is the next thing I need to prove
The control plane takes local etcd snapshots every six hours. The management host collects a recovery archive daily, including the snapshot, server token, and configuration. The token matters because K3s needs it to restore confidential datastore content.
I have checked that an initial archive exists and contains the expected files. I have not completed a disaster recovery or restore process.
My next test is a deliberate restore. I want to know I can recover this setup before putting important services on it.