Regression models


In machine learning, regression models help identify the relationships between variables, like what month of the year does the price of Christmas decorations go up? Most commonly, you would place the months of the year on the x-axis and the prices on y-axis. Regressions help us determine the general trend of the data we’re given. There are three kinds of regression: linear, polynomial, and logistic.
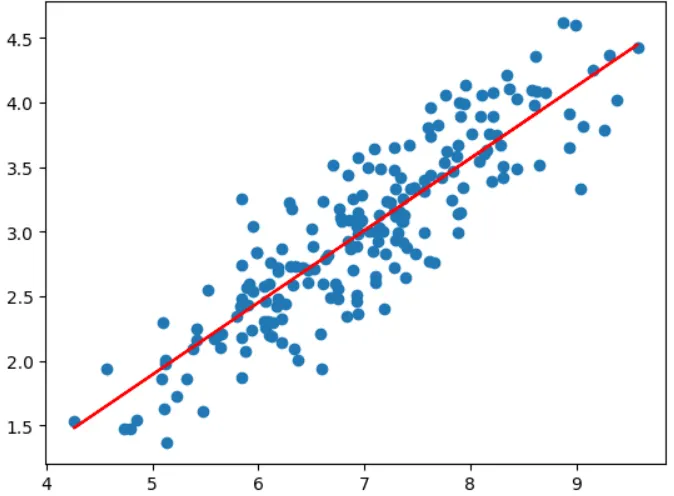
Linear is the most common and the most easiest out of the three. It’s simply just a straight line. Once you have all the points and plot them out, the “Line of Best Fit” determines the overall trend of the graph.

Here, the months are the x-axis and the price of the decor items are the y-axis. Notice, the points do not exactly fall on the line. By plotting the points and adding the formula, y₁~ mx₁+b, the graphing calculator immediately determines what line would be best. Although, this graph doesn’t exactly show us what month Christmas decorations are more pricey. It helps us predict future prices changes.
Get Aaradhana Abbaraboina’s stories in your inbox
Join Medium for free to get updates from this writer.
Polynomial regressions are an extension of linear regressions. They curve the line to represent relationships between variables.

I understand it’s not as easy to look at, but once you see the entirety of the graph, you can easily tell that the prices are low at the beginning of the yer, but when Christmas season starts, the prices start to go up. In the picture, underneath the table to the left, is the formula for polynomial regressions.
Linear and polynomial regressions are great for whenever we’re trying to predict numerical values, like the price of Christmas decorations. But what happens when we’re trying to find the color of the decor items just based on its size? That when logistical regressions start to take center stage.
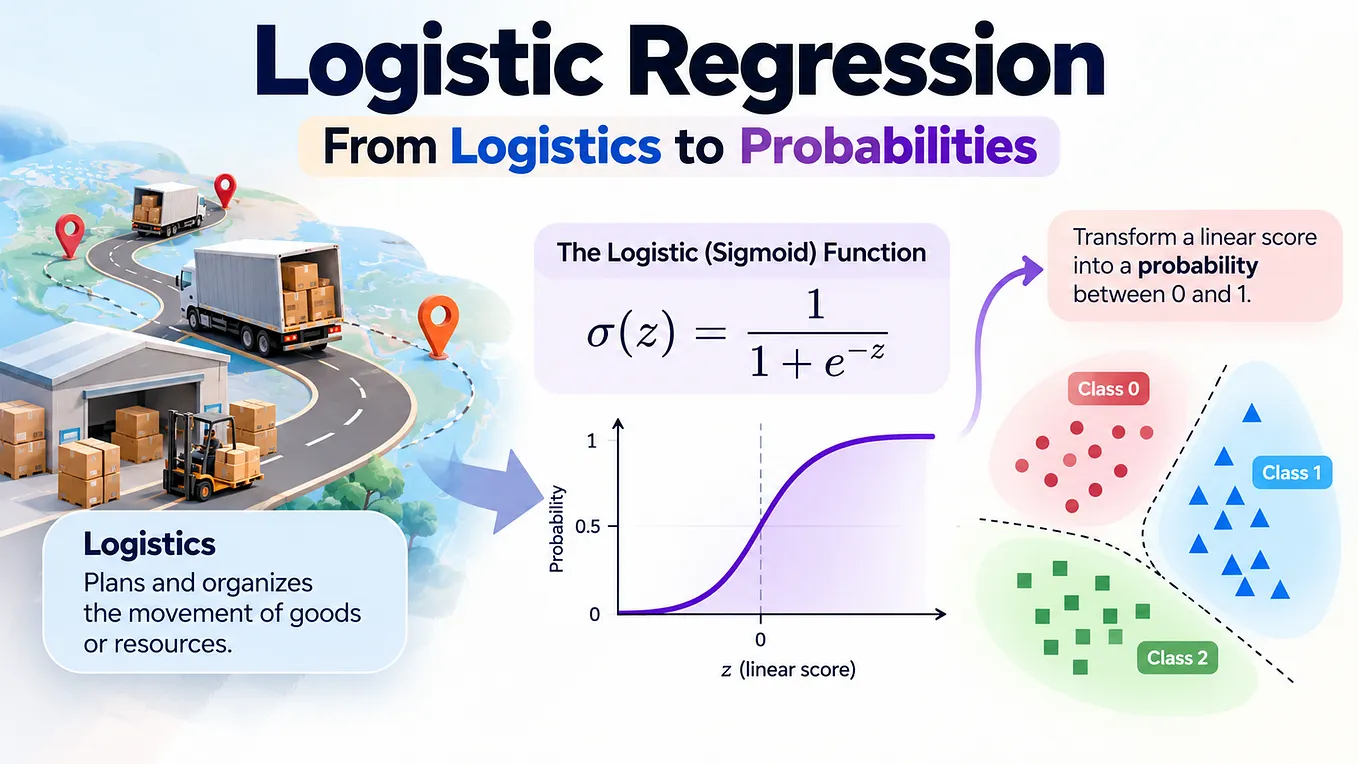
In logistical regressions, the thing you are trying to predict is not of numeric value, which means it’s considered a category, like what color the decorations are based on the size. Like in linear or polynomial regressions, instead of predicts numbers, we’re predicting a probability.

Here, the x-axis is the size of the decorations and the y-axis is the probability of the decor item being white. Depending on the size, the probability shifts up and down. On the left, underneath the table, the formula for logistical regressions is present.
The main take away here is that linear is a straight line and deals wit numbers. Polynomials is a curved line that also deals with numbers. Logistical is also a curved line but it deals with probability.