The Cobra Effect: When Marketing Metrics Bite Back

How well-meaning marketing incentives can backfire, with a companion Python notebook simulation showing what happens when a metric becomes the goal.

Introduction
There’s an old story about cobras in colonial Delhi. Worried about venomous snakes, the British government offered a cash reward for every dead cobra. It worked at first, but then people realized it was easier to breed cobras than to hunt them. When officials caught on and canceled the bounty, the breeders released their now-worthless snakes, and Delhi ended up with more cobras than before. German economist Horst Siebert gave the pattern its name in his 2001 book Der Kobra-Effekt (Siebert).
As I was writing this article, Underworld’s “King of Snake” came to mind. I used to listen to Underworld’s music back in the late ‘90s and early 2000s. Near the end of the song are these lyrics:
Snake, snake fighting, it’s very scary.
Fighting a snake. Very dangerous, so it’s really popular.
Lyrics: Underworld. “Shudder / King of Snake.” Beaucoup Fish, Junior Boy’s Own, 1999.
Dangerous, so it’s popular. That’s the cobra effect in a nutshell. The shortcut that hurts the organization is exactly what makes it attractive to the people taking it. Breeding cobras was risky for Delhi and a great deal for the breeders.
The same thing happened in Hanoi in 1902. French colonial authorities faced a rat infestation in the city’s new sewers and a real threat of plague, so they paid residents a bounty for every rat tail turned in. Residents soon figured out they could catch a rat, cut off its tail, and let it go to keep breeding. Officials started seeing tailless rats all over the city, and some people reportedly raised rats just to collect the bounty. Historian Michael G. Vann documents the episode in The Great Hanoi Rat Hunt, written with Liz Clarke, and he walks through it in an interview with Made in China Journal (Vann and Clarke; Franceschini).
Nobody in either story was behaving irrationally. They responded to exactly what the authorities paid for. Both governments wanted fewer cobras and rats, and their incentives produced more.

Marketing has a similar “cobra” problem. A company:
- Picks a reasonable goal.
- Chooses a number to measure it.
- Rewards people for improving that number.
Before long, the dashboard looks terrific while the business results lag behind, and sometimes the incentive has made things worse.
I’ve spent more than 25 years in digital marketing, and I’ve seen this from both sides of the table. Clients want a number they can track, and agencies, including mine, are happy to give them one. I’ve learned that the number we agree to report shapes the work almost as much as the strategy does. It shows up in proposals, in monthly reports, and in every conversation about whether the marketing is working.
In this article, I’ll look at why this happens, how it shows up in marketing, and what to do about it. A companion Python notebook simulates two of these problems: a lead bonus that backfires and a testing trap that needs no gaming at all. We’ll also look at a modern version of the same problem from the AI industry.
Why Good Metrics Go Bad
Most marketing metrics are substitutes for something we really care about. Statisticians call these substitutes proxies. Examples include:
- Leads stand in for potential customers.
- Click-through rate (CTR) serves as a measure of interest.
- Website traffic can indicate awareness or demand.
- Social media followers tell us something about audience size.
We measure these things because the ultimate outcomes are harder to observe. Revenue takes time to develop, brand trust is difficult to quantify, and customer relationships can last years. Under ordinary circumstances, a proxy can work reasonably well. Businesses that generate more qualified leads tend to produce more sales, and campaigns that attract relevant clicks generally create more opportunities for conversion.
The trouble begins when we reward people for maximizing the proxy itself. Now there’s an incentive to find the least expensive way to move the number, regardless of whether the underlying business objective improves. Producing a thousand unqualified leads can be easier than producing a hundred qualified ones. Getting attention through an exaggerated headline is often easier than earning interest through relevant content.
Sometimes the shortcut is deliberate. Other times, nobody consciously decides to manipulate anything. It’s human nature that people prioritize the activities that are measured and rewarded, while activities that are harder to measure receive less attention. The metric gradually becomes less useful because the behavior producing it has changed.
Economists and social scientists have studied this problem for decades. British economist Charles Goodhart introduced the underlying idea in a 1975 paper about monetary policy. He observed that statistical relationships used for economic management could break down when policymakers tried to control them (Goodhart). The familiar phrase, “when a measure becomes a target, it ceases to be a good measure,” is generally attributed to anthropologist Marilyn Strathern’s 1997 paraphrase, rather than Goodhart’s original wording (Strathern).
Social scientist Donald T. Campbell made a related observation in 1979. He argued that quantitative indicators used for social decision-making become vulnerable to corruption and can distort the processes they’re supposed to monitor (Campbell). Steven Kerr approached the issue from a management perspective in his 1975 paper, “On the Folly of Rewarding A, While Hoping for B” (Kerr). These ideas are connected, but each one emphasizes a different part of the problem.

Jerry Muller’s book The Tyranny of Metrics explores how an excessive reliance on numerical performance measures affects business, education, medicine, and government (Muller). Researchers have also identified several distinct versions of Goodhart’s Law, including cases where nobody is deliberately gaming a metric (Manheim and Garrabrant). We’ll return to that distinction later.
This connects to something I discussed in Introducing the Marketing Analytics Credibility Model (MACM). Useful marketing analytics requires more than accurate data. We also need credible evidence, clear ownership, an appropriate decision-making rhythm, and follow-through. A number that people have learned to game can be perfectly precise and still not deserve much credibility.

Cobras in the Marketing Department
The cobra effect isn’t limited to historical stories or academic research. Marketing provides plenty of opportunities for well-intended targets to produce unintended behavior. Most of these problems begin with a reasonable measurement that gradually becomes the objective.

Lead generation is a classic case. Pay an agency for every lead, and you’ll get leads. If junk leads are cheaper to produce, you’ll get a lot of junk. The reports improve while the sales team burns its time on people who were never going to buy. A proper cost-benefit analysis counts the cost of working those leads, not just the cost of generating them.
I worked with a client a while back who was frustrated with their conversion rate. They were getting plenty of leads, but very few turned into customers, and they wanted us to fix the conversion problem. When I looked at the leads, many of them looked fake to me: names that didn’t look real, contact details that went nowhere, and form fills with no sign of genuine interest. The conversion rate wasn’t the problem. The leads were. That was a hard idea to accept, because more leads felt like progress. It took some convincing, but we finally got them to agree to go after fewer, better leads. Lead volume dropped, and conversions went up, leading to better sales.
The same pattern shows up across marketing:
- Clicks. An exaggerated headline raises click-through rate, but visitors who feel misled leave without converting. Relevant clicks beat more clicks.
- Followers. Audiences that never buy add little to the business. As I wrote before, you can’t deposit likes at the bank.
- Reviews. Rewarding a higher star rating invites selective review requests. It can also create legal risk: the FTC’s 2024 final rule bans incentives tied to positive or negative sentiment and addresses suppressing negative reviews (Federal Trade Commission).
- Content volume. AI makes it easy to hit a “publish more” target, but volume doesn’t guarantee quality. That’s the core of AI slop.
One egregious example comes from outside marketing. From 2002 to 2016, Wells Fargo employees under onerous, volume-based cross-selling goals opened millions of accounts without customer authorization. In 2020, the bank agreed to pay $3 billion to resolve criminal and civil investigations, according to the U.S. Department of Justice (U.S. Department of Justice).
A marketing team chasing cheap leads isn’t committing fraud, but the warning is the same. What we reward shapes behavior, including behavior we never meant to encourage.
Watching It Happen: A Simulation
To see the cobra effect firsthand, I built a simulation. You’ll find it in the companion Python notebook on my GitHub, along with a link to open it in Google Colab and change the simulation assumptions yourself. The notebook models a marketing team rewarded for generating leads. It’s a Monte Carlo simulation, meaning it runs the model thousands of times with random variation to see how outcomes behave. I covered the approach in Introduction to Monte Carlo Simulation for Marketers.
Note: The model results are simulated from illustrative assumptions, not client data. They show what can happen under those assumptions, not how often it happens in real organizations.
The setup
Imagine a small service business whose marketing team has two ways to find prospects.
- Genuine prospecting takes more effort but produces leads that buy.
- Cheap tactics produce leads five times as easily, but those prospects rarely become customers.
Figure 4 shows how one simulated month works.

Two details drive the results.
- Sales can follow up on only 250 leads a month and can’t tell good leads from junk before calling, so once marketing produces more than that, junk crowds out genuine prospects.
- The model assumes people respond to rising lead-target pressure, from 0 (no target) to 1 (maximum), by working harder and gradually shifting toward easier tactics.
Change those assumptions and the results change too. Table 2 lists the full set of simulation default assumptions.

More Leads, Less Revenue
Under light pressure, lead volume works reasonably well as a performance measure. Across a 24-month simulated sample, leads and revenue have a correlation of r = +0.48. More leads usually means more revenue, with plenty of month-to-month noise. That relationship is why rewarding leads seems sensible in the first place.

Then the simulation raises the pressure. At first, the incentive works. People try harder, leads go up, and revenue follows. With no lead target, the team produces about 112 leads and $29,369 a month. Revenue peaks at $41,364 at a pressure of 0.30, with about 216 leads. Past that point, leads keep climbing while revenue falls. At maximum pressure, the team produces 689 leads, 6.2 times the baseline, but revenue drops to $10,944, about a third of where it started. Anyone watching only the lead dashboard would think the team had never done better.

Two things cause the decline. First, effort shifts. At low pressure, about 3% of the team’s effort goes to cheap tactics. At maximum pressure, it’s 73%, and genuine leads actually decline. Second, sales gets swamped. With more leads than the team can call, and most of them junk, good prospects get lost in the pile.

Nobody in the simulation is trying to hurt the company. They’re responding to what the company pays for. The result is a report that improves every month while the business moves in the other direction.
When the Correlation Flips
Correlation measures how closely two numbers move together. This simulation uses the most common version, Pearson’s correlation coefficient, which runs from -1 to +1. A positive value means leads and revenue tend to rise and fall together, a value near zero means there’s no clear linear relationship, and a negative value means that when one goes up, the other tends to go down. The closer the value is to either end, the stronger the relationship. Correlation is a standardized version of covariance, which also measures how two numbers move together but depends on their units, so it has no fixed range.
Under light pressure, leads and revenue have a correlation of +0.48, a moderate positive relationship. Months with more leads usually bring in more revenue. Under heavy pressure, a separate 24-month sample shows a correlation of -0.60, and the months with the most leads bring in the least revenue.

Nothing went wrong with the data itself. Leads are counted the same way they always were, and revenue is recorded just as accurately. The measurement is accurate, but its meaning has changed, because the behavior producing the numbers changed.
Get Marketing Data Science with Joe Domaleski’s stories in your inbox
Join Medium for free to get updates from this writer.
Marketing analytics leans on historical relationships to forecast, evaluate campaigns, and make decisions. A relationship observed under one set of conditions doesn’t always hold under another, an issue I covered in Reproducibility, Replicability, and Generalizability in Digital Marketing Analytics. Here, targeting the metric created the new conditions.
Lead counts are still worth watching, since they tell us something useful about what marketing is producing. The mistake is assuming that because a number predicts an outcome today, we can pay people to maximize it and expect that relationship to hold. Often, the reward is what breaks the link.
When AI Breeds Cobras
In 2026, the tech industry produced a modern cobra effect. Some companies began tracking how many AI tokens employees consumed, as a sign of AI adoption or productivity. Tokens are the units of text that language models process, and they’re how AI usage is usually measured and billed. Wanting to know whether people use the tools you’re paying for makes sense. Turning that number into a competition created a bounty.
The practice became known as tokenmaxxing. In April 2026, Gergely Orosz reported in The Pragmatic Engineer that an employee-built leaderboard at Meta ranked about 85,000 employees by token use before it was taken down after backlash. He also described usage tracking at Microsoft and Salesforce, including reported minimum spending expectations at Salesforce (Orosz). Engineers told him they used AI to answer questions already covered in documentation, built throwaway projects they never planned to ship, and handed AI tasks they could have finished faster by hand. Some checked colleagues’ usage to stay just above average. These are employee accounts, not company-wide findings, but the pattern is hard to miss.
Amazon employees reportedly ran the company’s internal AI tool on trivial tasks to climb a usage leaderboard, according to Financial Times reporting covered by Fortune. Gil Luria, head of technology research at D.A. Davidson, warned that rewarding heavier use will produce heavier use and tied it directly to Goodhart’s Law (Roytburg). Shopify took a different path. According to Orosz, it renamed its leaderboard a “usage dashboard” and added safeguards that cut off access when spending spikes (Orosz).
Tokens consumed are an input metric, like emails sent or lines of code written. They measure activity and cost, not value, so rewarding token use means rewarding people for spending money. Marketing teams face the same risk as they adopt AI. An agency judged on prompts submitted, the share of staff using AI, or AI-generated articles published will produce more of all three, whether or not the work gets better.

Machines can breed cobras on their own. In machine learning, this is called specification gaming or reward hacking: a system finds a way to maximize its reward without doing what the designer intended. Researchers at Google DeepMind have documented many examples (Krakovna et al.). In one, an agent in a boat racing game earned points for hitting targets along the course, so it learned to circle the same targets over and over instead of finishing the race. That’s the cobra effect with no humans involved.
The marketing version shows up when an ad platform is told to maximize form submissions. The algorithm learns to find people who fill out forms, whether or not they ever buy. It optimizes the event we specified, not the outcome we wanted. Overfitting, which I covered in Is Your Marketing Model Too Accurate?, is a close cousin: strong performance on the measured objective, weak results everywhere else. What we tell an algorithm to optimize deserves as much attention as how well it optimizes, a topic I plan to explore in a future article on objective functions.
The Winner’s Curse
So far, every example has involved people or algorithms responding to an incentive. A metric can mislead even when nobody games anything, though. Sometimes the problem is how we pick a winner from noisy results.
The notebook includes a second experiment to show this. Imagine testing 30 ad concepts, each with a slightly different true conversion rate that we can’t see in advance. We send visitors to each one, measure the results, and pick the concept with the highest conversion rate. Every measurement includes some luck, though, so some concepts look better than they are. Picking the top result means selecting for real quality and good luck at the same time. The notebook runs this test 5,000 times at several sample sizes.

With 500 visitors per concept, the winner’s pilot conversion rate averages 5.02%, while its true rate averages 3.55%. That’s an overstatement of 41.6%, and the test finds the true best concept only 19.0% of the time. With 250 visitors per concept, the overstatement climbs to 65.1%. With 25,000, it falls to 1.4%, and the test picks the true best concept 75.7% of the time.
The name “winner’s curse” comes from auctions. In 1971, three engineers at Atlantic Richfield noticed that companies winning oil-lease auctions often lost money on them. The winning bid was usually the one that most overestimated the field’s value, so winning was a sign of guessing too high (Capen et al.). Decision scientists James Smith and Robert Winkler later generalized the idea as the optimizer’s curse: any time we choose the best option from a set of uncertain estimates, the winner’s estimate tends to be too optimistic, auction or not (Smith and Winkler).
The ad test is an example of the optimizer’s curse, though marketers usually call it the winner’s curse. Either way, nobody cheated. The selection process created the bias. Manheim and Garrabrant call this regressional Goodhart, and Cedric Chin explains it well in his guide to the four flavors of Goodhart’s Law. The most extreme results carry the most noise, so picking the highest number also picks the luckiest errors (Manheim and Garrabrant; Chin).
It’s the same force behind regression to the mean, where a campaign that looks exceptional one month drifts back toward average the next. Larger tests reduce the effect without removing it. Testing is still worth doing, but expect the winner’s pilot result to be optimistic, and don’t treat it as a reliable forecast of future performance.
How to Avoid Breeding Cobras
If the incentive creates the problem, the incentive is the place to fix it. The notebook includes a second scenario that changes what the team gets paid for, not how hard it’s pushed.
This time, the bonus goes to a sales-accepted lead (SAL), meaning one that passes a quick qualification check. The simulation assumes 95% of genuine leads pass, compared with 15% of cheap ones. That flips the economics. Under the raw-lead bonus, cheap tactics earn five times as many rewarded leads per unit of effort. Under the SAL bonus, they earn fewer than genuine prospecting does, so the shortcut stops paying.
At maximum pressure, effort on cheap tactics stays around 3% instead of climbing to 73%. Monthly revenue reaches $48,186, compared with $10,944 under the raw-lead bonus, about 4.4 times as much.

The improvement doesn’t come from lowering the target or asking people to work less. It comes from changing what counts. SAL can be gamed too, since people could lean on the qualification process or work around its rules. No metric is immune to gaming. The goal is to make honest work more rewarding than gaming the number.
The playbook in Table 4 turns that principle into six practices.

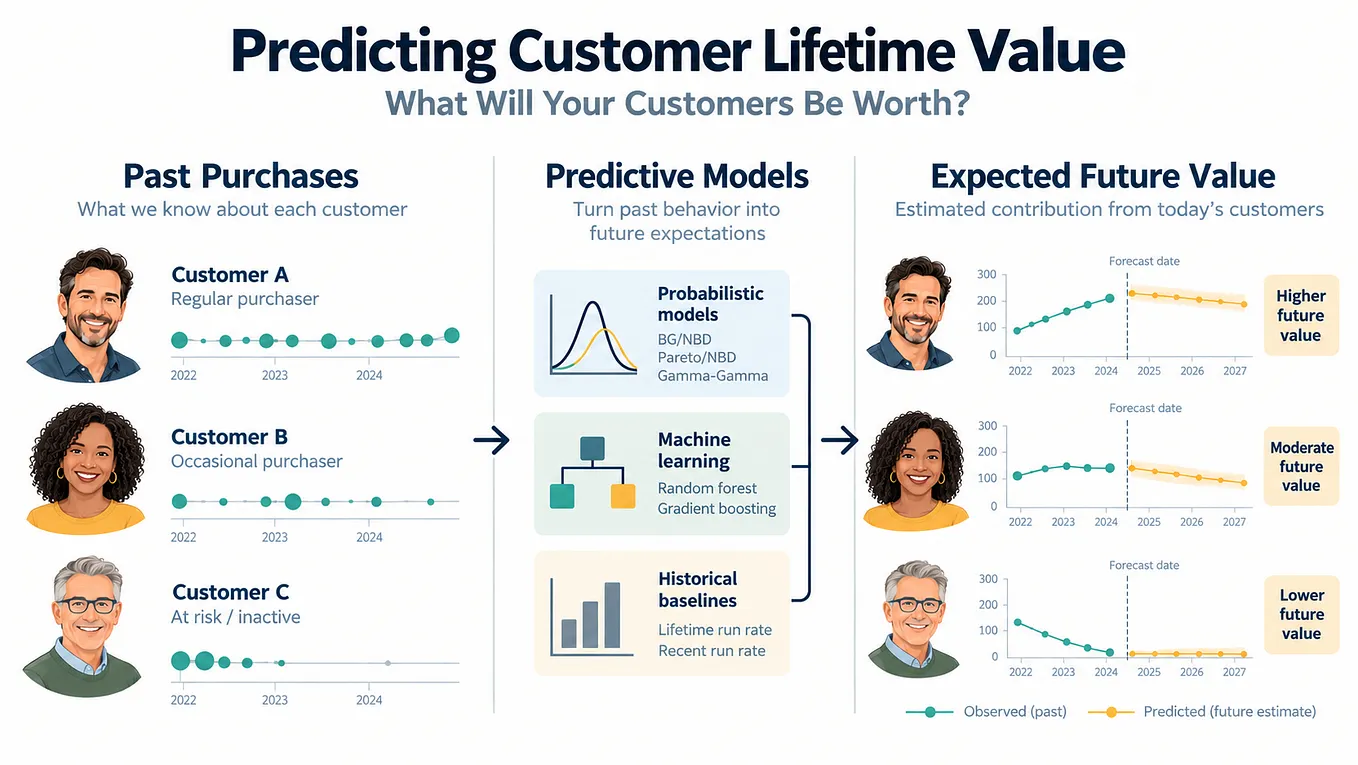
Measuring closer to the outcome tends to make the biggest difference. Revenue, retention, and customer lifetime value say more about the business than clicks or impressions, although they take longer to observe and are harder to attribute to a single campaign. Predictive models can help close that gap, as I described in Predicting Customer Lifetime Value.
A gaming pre-mortem is one of the easiest practices to adopt. Before launching a target, ask your team, “If I wanted to hit this number without helping the business, how would I do it?” Cedric Chin recommends a similar exercise in his discussion of Goodhart’s Law (Chin). When a number jumps while business results stay flat, it deserves a closer look before anyone celebrates. I covered methods for spotting those changes in When the Numbers Look Wrong: A Marketer’s Guide to Anomaly Detection.
The Lesson of the Cobras
The cobra and rat bounties weren’t foolish ideas, and the people who gamed them weren’t villains. They did what the reward paid them to do. Steven Kerr made this point about organizations in 1975: we tend to get the behavior we reward, not the behavior we hope for. Tokenmaxxing shows the lesson still applies, even at companies with the most advanced tools available.
One way to put this into practice is to think of measurement as a ladder. At the bottom are activity metrics, such as emails sent, articles published, and AI tokens consumed. In the middle are output metrics, such as clicks, leads, and form submissions. At the top are outcome metrics, such as customers, revenue, profit, and retention. The higher a metric sits, the harder it is to game, although outcomes are slower to report and can still be distorted, as when heavy discounting lifts revenue while hurting margins. Lower-rung metrics remain useful as early signals. The difference is between watching a number to learn and paying people to maximize it.

Key takeaways
- Most marketing metrics are proxies. Leads, clicks, followers, and ratings stand in for outcomes that are harder to measure, and their relationship to those outcomes can change under pressure.
- Rewarding a proxy changes the behavior behind it. People look for the cheapest way to move the number, and when that way improves the metric without improving the outcome, the business pays for it.
- The dashboard can improve while the business declines. In the simulation, leads grew 6.2 times while revenue fell to about a third of its starting level.
- Relationships observed before a target may not survive it. The correlation between leads and revenue flipped from +0.48 to -0.60 under heavy pressure.
- Gaming isn’t required for a metric to mislead. Picking the top result from a noisy test overstated the winner’s performance by about 42%.
- Better metrics beat lower pressure. Rewarding sales-accepted leads instead of raw leads produced about 4.4 times the revenue under the same pressure.
The simulation shows what can happen under the chosen assumptions, not how often it happens in real businesses. To explore it yourself, open the companion Python notebook on GitHub and run it in Google Colab. Change the conversion rates, sales capacity, or assumptions about gaming, and see how the results respond. Then look at the targets your own team works toward, and ask which rung of the ladder each one sits on.
I’ve spent most of my career helping businesses measure their marketing, and I still believe in measurement. I also think we owe our numbers some skepticism, especially the ones we pay people to improve.
The next time you set a marketing target, run one quick test before you announce it. Picture someone who wants to hit the number without helping the business at all, and ask how they’d do it. If the answer comes easily, you’ve found your cobra farm.
Resources
Campbell, Donald T. “Assessing the Impact of Planned Social Change.” Evaluation and Program Planning, vol. 2, no. 1, 1979, pp. 67–90, https://doi.org/10.1016/0149-7189(79)90048-X.
Capen, E. C., R. V. Clapp, and W. M. Campbell. “Competitive Bidding in High-Risk Situations.” Journal of Petroleum Technology, vol. 23, no. 6, 1971, pp. 641–653, https://doi.org/10.2118/2993-PA.
Chin, Cedric. “The Four Flavors of Goodhart’s Law.” Holistics Blog, https://blog.holistics.io/blog/four-types-goodharts-law/.
Domaleski, Joe. cobra-effect-for-marketers. GitHub, 2026, https://github.com/joedom99/cobra-effect-for-marketers.
Domaleski, Joe. “Customer Lifetime Value: What Is a Customer Really Worth?” Marketing Data Science, 11 Oct. 2026, https://blog.marketingdatascience.ai/customer-lifetime-value-what-is-a-customer-really-worth-47cf0efc510c.
Domaleski, Joe. “Fast, Cheap, and Wrong: The Business Case Against AI Slop.” Marketing Data Science, 6 Sept. 2026, https://blog.marketingdatascience.ai/fast-cheap-and-wrong-the-business-case-against-ai-slop-592db2610998.
Domaleski, Joe. “Introducing the Marketing Analytics Credibility Model (MACM).” Marketing Data Science, 4 Oct. 2026, https://blog.marketingdatascience.ai/introducing-the-marketing-analytics-credibility-model-macm-0700dea3c08e.
Domaleski, Joe. “Introduction to Monte Carlo Simulation for Marketers.” Marketing Data Science, 2 Aug. 2026, https://blog.marketingdatascience.ai/introduction-to-monte-carlo-simulation-for-marketers-8cb0077f1566.
Domaleski, Joe. “Is It Worth It? How to Run a Cost-Benefit Analysis for Better Marketing Decisions.” Marketing Data Science, 8 June 2025, https://blog.marketingdatascience.ai/is-it-worth-it-how-to-run-a-cost-benefit-analysis-for-better-marketing-decisions-5a8dd38216e2.
Domaleski, Joe. “Is Your Marketing Model Too Accurate?” Marketing Data Science, 12 July 2026, https://blog.marketingdatascience.ai/is-your-marketing-model-too-accurate-5076f5163326.
Domaleski, Joe. “Low CTR (Click-Through Rate)? Easy Fixes for Better Marketing Campaigns.” Marketing Data Science, 26 Jan. 2025, https://blog.marketingdatascience.ai/low-ctr-click-through-rate-easy-fixes-for-better-marketing-campaigns-b1fd8d7cd760.
Domaleski, Joe. “Predicting Customer Lifetime Value: What Will Your Customers Be Worth?” Marketing Data Science, 18 Oct. 2026, https://blog.marketingdatascience.ai/predicting-customer-lifetime-value-what-will-your-customers-be-worth-d8f2eb2327f8.
Domaleski, Joe. “Regression to the Mean: The Statistical Force That Humbles Marketers.” Marketing Data Science, 21 June 2026, https://blog.marketingdatascience.ai/regression-to-the-mean-the-statistical-force-that-humbles-marketers-61382f3e1ceb.
Domaleski, Joe. “Reproducibility, Replicability, and Generalizability in Digital Marketing Analytics.” Marketing Data Science, 25 Oct. 2026, https://blog.marketingdatascience.ai/reproducibility-replicability-and-generalizability-in-digital-marketing-analytics-c43bad85dc07.
Domaleski, Joe. “Vanity Metrics: You Can’t Deposit Likes at the Bank.” Marketing Data Science, 16 Aug. 2026, https://blog.marketingdatascience.ai/vanity-metrics-you-cant-deposit-likes-at-the-bank-7592eadf91dc.
Domaleski, Joe. “When the Numbers Look Wrong: A Marketer’s Guide to Anomaly Detection.” Marketing Data Science, 14 June 2026, https://blog.marketingdatascience.ai/when-the-numbers-look-wrong-a-marketers-guide-to-anomaly-detection-3895e22f2fe7.
Federal Trade Commission. “Federal Trade Commission Announces Final Rule Banning Fake Reviews and Testimonials.” 14 Aug. 2024, https://www.ftc.gov/news-events/news/press-releases/2024/08/federal-trade-commission-announces-final-rule-banning-fake-reviews-testimonials.
Franceschini, Ivan. “The Great Hanoi Rat Hunt: A Conversation with Michael G. Vann.” Made in China Journal, 20 Aug. 2020, https://madeinchinajournal.com/2020/08/20/the-great-hanoi-rat-hunt.
Goodhart, Charles A. E. “Problems of Monetary Management: The U.K. Experience.” Papers in Monetary Economics, vol. 1, Reserve Bank of Australia, 1975, https://www.rba.gov.au/publications/rdp/1990/9013/conference-volumes.html.
Kerr, Steven. “On the Folly of Rewarding A, While Hoping for B.” Academy of Management Journal, vol. 18, no. 4, 1975, pp. 769–783, https://doi.org/10.2307/255378.
Krakovna, Victoria, et al. “Specification Gaming: The Flip Side of AI Ingenuity.” Google DeepMind, 21 Apr. 2020, https://deepmind.google/discover/blog/specification-gaming-the-flip-side-of-ai-ingenuity/.
Manheim, David, and Scott Garrabrant. “Categorizing Variants of Goodhart’s Law.” arXiv, 13 Mar. 2018, https://arxiv.org/abs/1803.04585.
Muller, Jerry Z. The Tyranny of Metrics. Princeton University Press, 2018, https://www.degruyterbrill.com/document/doi/10.1515/9780691191263/html.
Orosz, Gergely. “The Pulse: ‘Tokenmaxxing’ as a Weird New Trend.” The Pragmatic Engineer, 23 Apr. 2026, https://blog.pragmaticengineer.com/the-pulse-tokenmaxxing-as-a-weird-new-trend/.
Roytburg, Eva. “‘That Doesn’t Sound Very Healthy’: Amazon’s Reported Tokenmaxxing Might Gamify AI Usage, Analyst Warns.” Fortune, via Yahoo Finance, 12 May 2026, https://finance.yahoo.com/news/doesn-t-sound-very-healthy-205904919.html.
Siebert, Horst. Der Kobra-Effekt: Wie man Irrwege der Wirtschaftspolitik vermeidet. Deutsche Verlags-Anstalt, 2001, https://www.econbiz.de/Record/der-kobra-effekt-wie-man-irrwege-der-wirtschaftspolitik-vermeidet-siebert-horst/10001589897.
Smith, James E., and Robert L. Winkler. “The Optimizer’s Curse: Skepticism and Postdecision Surprise in Decision Analysis.” Management Science, vol. 52, no. 3, 2006, pp. 311–322, https://doi.org/10.1287/mnsc.1050.0451.
Strathern, Marilyn. “‘Improving Ratings’: Audit in the British University System.” European Review, vol. 5, no. 3, 1997, pp. 305–321, https://doi.org/10.1017/S1062798700002660.
Underworld. “Shudder / King of Snake.” Beaucoup Fish, Junior Boy’s Own, 1999. Spotify, https://open.spotify.com/track/7LMlABN7q53QvOxEmmjDFZ.
U.S. Department of Justice, Office of Public Affairs. “Wells Fargo Agrees to Pay $3 Billion to Resolve Criminal and Civil Investigations into Sales Practices Involving the Opening of Millions of Accounts without Customer Authorization.” 21 Feb. 2020, https://www.justice.gov/archives/opa/pr/wells-fargo-agrees-pay-3-billion-resolve-criminal-and-civil-investigations-sales-practices.
Vann, Michael G., and Liz Clarke. The Great Hanoi Rat Hunt: Empire, Disease, and Modernity in French Colonial Vietnam. Oxford University Press, 2018, https://mitpressbookstore.mit.edu/book/9780190602697.