Logistic regression using Sigmoid
Perceptron trick was relatively quite simple → We used to see if the data point is misclassified, we used to move the line towards the point or away from it, and we would do nothing if the point was correctly classified. This algorithm is really quite inferior to more modern classification tools. To improve the performance and robustness of our algorithm we are gonna introduce a new step function — Sigmoid Function.

As we can see our solution is very far from the optimal Line. We will change our algorithm to enhance the performance of our model.
Our model :

This only moved the line when the point was misclassified. We will make this different, how? Now we will move the line even when the point is correctly classified,
We will move the line towards the point if its correctly classified and away from it if its misclassified.
Another thing we are going to introduce is the method for determining how much impact each point has on moving the line. Impact will be directly proportional to the distance between the lines and the points, this means that the point which is far away from the line will have more impact than than the point which is closer to the line.
Forming the new equation

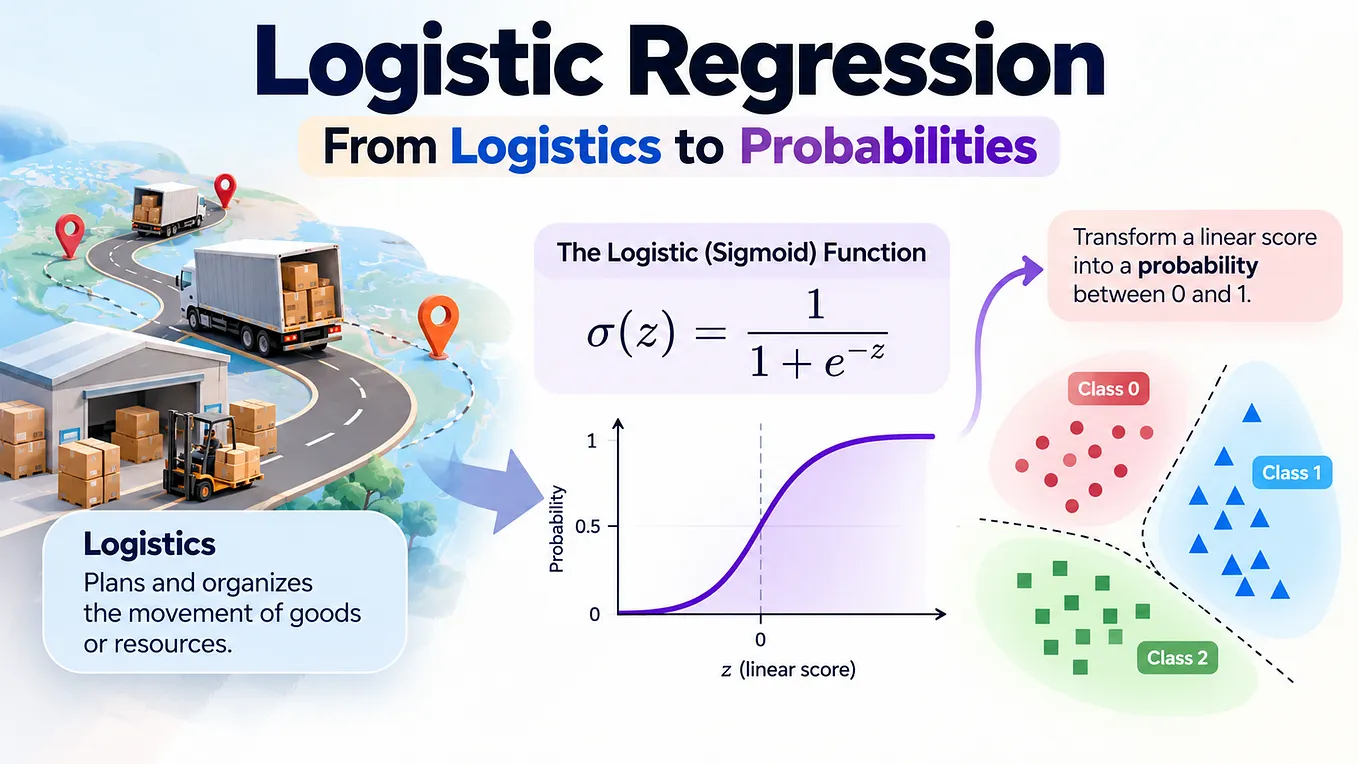
What you see here is the graph of sigmoid function which is :

One thing special about this function is that this function ranges from 0 > z > 1. This function is also referred to as the sigmoid squashing function, as it maps input values of any magnitude, whether very large or very small ,into the bounded range between 0 and 1.
Get Razacreatesit’s stories in your inbox
Join Medium for free to get updates from this writer.
We are going to replace the step function in our earlier model with a sigmoid function :

So instead of y — y_hat getting converted to either 0 or 1 from step function from our previous algorithm it will now go through the sigmoid function which will give us a value ranging from 0 to 1
Example
Suppose we have a feature space with four points and a decision boundary (classification line). We calculate if the points are on the positive or negative region of the line, basically we calculate Wi Xi for the points, or Z.

Now we calculate Yi-hat for every point, but Yi-hat is just Sigmoid(Z). So,

Greater the value for Z closer it is to 1 and lower the value for Z closer it is to 0.
Now we calculate Yi — Yi_hat

So W gets updated for every single point, this gives us better coefficients for the line of best fit
So when plotting this line against our database we get this :

We got the red line from our previous algorithm using perceptron trick with the step function, the brown line is the current algorithms creation which is slightly better, but the black line the beast, generated by Scikit learn goes one step further and gets the best line of fit. We will discuss this next.
We now know that by changing even a simple function from step to sigmoid the performance of our algorithm increases significantly.