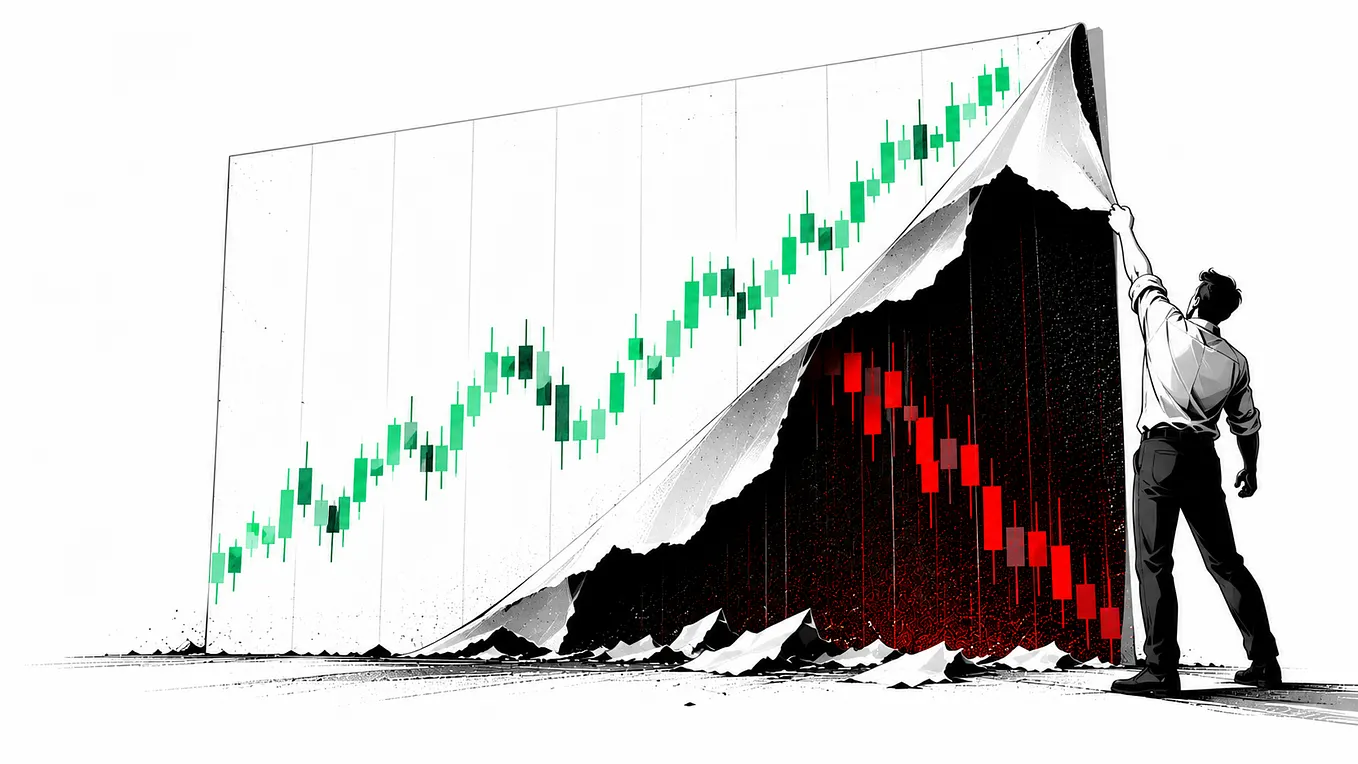
Why Win Rate Matters Less Than You Think?
We ran two imaginary traders through 20,000 simulated runs of 250 trades each. The one who was wrong most of the time came out ahead almost every time.

“Eight out of ten trades are green. So why is my account red?”
Somebody types that into a trading group chat tonight. Maybe in Lagos, maybe Jakarta, maybe a flat in Manchester. Same screenshot every time: a column of green ticks and a balance that went the other way.
The replies never change either. “It’s discipline, bro.” “Tighten your stop.”
Then, in August 2026, India’s market regulator SEBI published a study of retail options traders. People who mostly sell options lost money far less often than people who mostly buy them. But when the sellers did lose, the average loss was roughly 40 times bigger.
We went digging, expecting win rate to be a decent number with a few blind spots. What we found changes the question. Win rate is a dial you can turn on purpose, with no skill at all. We proved it with a coin.
Two words before we start
Win rate is the share of your trades that finish in profit. Eight green out of ten is an 80% win rate.
Expectancy is what one average trade earns you, once you count both how often you win and how big the wins and losses are. Think of it as the reading on the till at closing time. Keep both words in your pocket. We will need them.
The map
Five questions today:
1. Why does a high win rate feel so good?
2. Can you be right 80% of the time and still go broke?
3. Can you be wrong most of the time and still win?
4. Can anyone fake a win rate?
5. What do the machines count instead, and where does that leave you?
And one question under all of them. If the most profitable trading machine ever built is right barely more than half the time, why do the rest of us grade ourselves on being right?

QUESTION 1 OF 5
Why does a high win rate feel so good?
Think about how it feels to cross things off a to do list. Ten jobs, nine ticks, you go to bed pleased. Nobody asks how big the jobs were.
Your brain keeps the same kind of list for trades. It counts items done. It does not count money.
There is old, well known evidence for this. In 1998 the researcher Terrance Odean studied 10,000 accounts at a US discount broker, covering 1987 to 1993. Investors sold about 14.8% of the winning positions they could have sold, and only about 9.8% of the losing ones. They cashed winners roughly 50% more eagerly than they closed losers.
Economists call this the disposition effect. We call it the rug. Take the profit quickly, sweep the loser under the rug and wait for it to “come back”.
Here is the catch. A loser you have not closed never shows up in your win rate. The scoreboard only counts finished trades. So the rug does two things at once: it makes your win rate look lovely, and it lets the real damage grow where you cannot see it.
To be fair, a high win rate does a real job. It keeps people calm and in the game, and a trader who feels in control is less likely to tilt and do something silly. Anyone who has watched eleven red trades in a row knows how much that matters.
So the first idea is the to do list trap. Your brain counts ticks. Your bank counts size.
That is still the gentle version. The dangerous version is what happens when the list gets very, very green.

QUESTION 2 OF 5
Can you be right 80% of the time and still go broke?
Imagine you sell rain insurance to a whole town. Every sunny day you collect a small fee from everyone. Nobody complains. You “win” almost every day.
Then one afternoon the storm arrives, and you owe the whole town. That is the shape of a lot of high win rate trading.
The arithmetic is short. If your average win is R times as big as your average loss, you need to win at least 1 divided by (1 + R) of the time just to break even.
Plug in a few cases.
If your average win equals your average loss, you need 50%.
If your wins are twice your losses, you need only 33.3%.
If your wins are one fifth the size of your losses, you need 83.3%.
So we reran it ourselves. We built an imaginary trader, call him Trader A. He wins 80% of the time. Each win makes 1 unit, each loss costs 5 units. That sounds fine. It is not: 0.8 times 1, minus 0.2 times 5, is minus 0.2 units per trade. His expectancy is negative.
We let Trader A trade 250 times, and we repeated that 20,000 times. About 9% of his runs finished above zero. The typical run finished around 50 units down.
And the nasty bit: after his first 20 trades, Trader A was ahead in 41% of the runs. After 50 trades, in 31%. Four times in ten, he looked like a genius for a little while. [Simulation details at the end.]
Real life has a famous version of this. On February 5, 2018, the VIX volatility index jumped 115.6% in a single day. A popular note called XIV, built to profit when markets stayed calm, lost 96.3% of its value and was shut down by its issuer. For years it had looked like free money.
And SEBI’s August 2026 study shows the same two sided picture. Among retail traders who mostly buy options, around 90% ended the year losing. Among those who mostly sell options, around 44% did. Looks safer.
But the average loss among the sellers who lost was about ₹51.7 lakh, against about ₹1.3 lakh for the buyers who lost. (A lakh is 100,000, so that is roughly 5.2 million rupees versus 130,000.) SEBI itself calls this a tail risk asymmetry.
One honest warning on that data. The strategy comparison comes from a random sample of 5,050 traders, and the option sellers were only about 2% of it. Treat the exact numbers as a rough guide, and SEBI is clear these are patterns, not proof of cause.
Fair objection: people who sell options for a living have a real answer. The tastylive crowd, one of the best known, teaches trading small, closing winners early and often using spreads with a capped loss, so one bad day cannot sink you. A trader who does all of that is not Trader A. But notice what is doing the work. It is the sizing and the loss cap, not the win rate.
So the second idea is the rain insurance trap. A high win rate is often a bill that has not arrived yet.
Now flip the picture. What about the trader who loses most of the time?

QUESTION 3 OF 5
Can you be wrong most of the time and still win?
Watch a striker in football. Most of his shots go wide, get blocked or end up in the keeper’s gloves. Nobody calls him useless. The one that goes in wins the match and pays his wages.
Same math, other direction. If your wins are three times your losses, you only need to win 25% of the time to break even.
So we built Trader B. He wins just 35% of the time. Each win makes 3 units, each loss costs 1. His expectancy is plus 0.4 units per trade: 0.35 times 3, minus 0.65 times 1.
Same test, 20,000 runs of 250 trades. Trader B finished above zero in more than 99.9% of them. The typical run ended about 98 units up. Trader A’s typical run ended 50 down. One of them is wrong most of the time. Guess which.
The real world looks like this too. A trend following manager, East Coast Capital Management, told Finance News Network that about 40% of its trades win and about 60% lose.
A physics paper with the cheeky title “Trend followers lose more often than they gain” argues that a 40% win rate mostly tells you winners are held about twice as long as losers. Read that again. Here, win rate is a clock reading, not a talent reading.
Now the big one. Robert Mercer, long a senior figure at Renaissance Technologies, the firm behind the Medallion Fund, reportedly told a friend that they are right a little over half the time, but “100 percent right 50.75 percent of the time.” That is from Gregory Zuckerman’s book The Man Who Solved the Market.
Another Renaissance mathematician, Elwyn Berlekamp, argued that if you trade a lot, you only need to be right about 51% of the time. Bloomberg reported in 2017 that the fund has been kept small to protect returns of around 40% a year after fees.
We wanted to feel that 50.75% in our own hands, so we ran the maths. Take equal sized bets, each one 50.75% likely to win. After 100 bets, the chance you are ahead is only about 56%. After 1,000 bets, about 68%. After 10,000, about 93%. After 100,000, it is effectively certain.
An edge like that needs volume. A machine can place a hundred thousand bets. Most of us place far fewer.
Here is the catch, and it is a human one. Trader B’s life feels awful. In our runs, his longest losing streak was a median of 11 trades in a row. In 70% of runs he hit at least one stretch of 10 straight losses. He was winning all along, on paper. So how do you feel looking at your own screen on loss number nine?
Fair objection, two of them. Mercer was probably not giving the exact numbers, and Zuckerman says as much. And trend followers have spent years in choppy markets going nowhere. A low win rate with a big payoff is not free money. It is a different bill, and you pay it in patience.
So the third idea is the striker’s deal. You pay in misses and get paid in goals.
By now you might suspect win rate is easier to bend than it looks. It is. We bent it with a coin.
|
QUESTION 4 OF 5
Can anyone fake a win rate?
Picture a roulette table. Bet on red and you win almost half the time. Put the same money on one single number and you win about once in 37 spins. Same wheel. On a standard single zero wheel, the casino keeps the same cut either way.
The only thing that changed is the shape of your bet: lots of small wins versus rare big ones. Markets let you do exactly that with a stop and a target.
A stop is the price where you give up and take the loss. A target is the price where you cash in. Put the stop far away and the target close, and you will win a lot. Flip them and you will win a little.
Get Xtin Capital’s stories in your inbox
Join Medium for free to get updates from this writer.
So we tested it. We built a price that moves one step up or down at random, like a coin flip. By construction it has no edge at all. Then we traded it with different targets and stops, 40,000 trades for each setting.
Target 1 step, stop 9 steps: we won 89.7% of the time.
Target 1, stop 4: 79.9%.
Target 2, stop 2: 50.1%.
Target 4, stop 1: 20.2%.
Target 9, stop 1: 9.8%.
The average profit per trade in every one of those rows was within a hair of zero, between minus 0.026 and plus 0.009 of a step. That is just noise. Then we added a small cost, one tenth of a step per trade, the sort of fee and spread every real trader pays. Every row turned negative, between minus 0.09 and minus 0.13.
Win rate went from 10% to 90% and the edge never left zero. The maths behind it is almost insultingly simple: your win rate is the stop distance divided by the total of stop and target. You are not finding an edge. You are choosing a number.
So the fourth idea is the dial. Win rate is a dial, not a diploma.
And dials sell. A win rate is the cheapest number in trading to manufacture, which may be why it gets put on posters. In January 2024 the US CFTC warned that scammers claim AI bots with “100% win rates”. In May 2026 CryptoBriefing reported community built trading bots on a prediction market with claimed win rates somewhere between 56% and 72%, thin verification, and one promotional PDF that turned out to contain fabricated screenshots.
Fair objection: real prices are not coin flips. They trend, they gap, they have fat tails, and a real strategy’s win rate can tell you something about its shape. Agreed. It describes the shape. It cannot tell you whether the shape is any good.
So if win rate can be dialled, what do the people who actually get paid look at? And what happens to everyone else?

QUESTION 5 OF 5
What do the machines count instead, and where does that leave you?
A shopkeeper does not count how many customers left smiling. She counts what is in the till at closing time.
Machines count the till. For a machine, every decision is a bet with a size, a cost and an average result. It does not feel loss number nine. It does not move a stop at 2 a.m. because it hates being wrong.
Now look at how people do. SEBI’s August 2026 study looked at about 4 crore (40 million) trader quarters. Only 15.4% of them were profitable. The median profit in a winning quarter was ₹4,366. The median loss in a losing quarter was ₹10,525, about 2.4 times bigger. And among traders who had both winning and losing quarters, 78.7% lost more in their bad quarters than they made in their good ones.
Small note: those are quarters, not individual trades. But read the shape. It is the striker’s deal in reverse. The misses are common, and the goals are small.
Zoom out and the numbers keep telling the same story. SEBI found that 87.7% of individual derivatives traders lost money in the 2026 financial year, around ₹91,685 crore in total.
A 2020 study by Chague, De-Losso and Giovannetti followed Brazilian day traders who started between 2013 and 2015. Of those who lasted more than 300 days, 97% lost money, and only 0.4% beat a bank teller’s pay.
A Taiwan study by Barber, Lee, Liu and Odean found that fewer than 1% of day traders could predictably earn a profit after fees.
And when a 2019 Babypips review checked the loss disclosures that European rules force CFD brokers to publish, it found 54% to 83% of retail accounts losing money, with an average of 76%.
Different countries, same shape.
So where does a person fit? Not in being right more often than the machine. We see three places.
One, choosing which bets exist at all, which includes noticing when a pattern has stopped working. Two, sizing the bet. Three, the dull one: staying in the chair through the losing streak.
The machine gets the third one for free. For a person it is the whole game, and Question 1 explains why. Our brain keeps score in ticks.
That is why the trader is turning into the bottleneck. Win rate is the number that measures how you feel. Expectancy is the number that measures what you earn. A machine only has the second one. That is its entire unfair advantage, and you can borrow it for free.
Fair objection: humans do have an edge. A machine trained on the last five years can keep doing the old thing long after the pattern has died, and someone has to notice and pull the plug. So the person is not useless. The person is just badly placed in exactly the part of the job where feelings live.
So the fifth idea is the till. Count what is in the drawer.
Time to take a side.

The verdict.
First, the camps.
The probability camp. The best known voice here is the tastylive team: aim for a high chance of profit on each trade, trade small, close winners early.
The payoff camp. Trend followers, such as East Coast Capital Management, who accept losing most of the time because the winners run.
The volume camp. Renaissance’s Mercer and Berlekamp, who think in thousands of small, almost coin flip bets.
Second, the evidence.
The probability camp has a real point: SEBI’s data does show option sellers lose less often. But the same data shows the loss when it comes is enormous, and XIV is the reminder. Their answer is small size and a capped loss, which works, but it means the win rate is not what is doing the work.
The payoff camp has transparent maths. Anyone can recompute the break even in ten seconds, and we did. Their weak spot is human: long dry spells and streaks that would test anyone.
The volume camp has the strongest results and the weakest paper trail. We have a quote, a book and a Bloomberg report. We do not have audited trade logs. And their method needs volume that you and we do not have.
Third, where they quietly agree.
None of the three sells win rate on its own. They all talk about size. Trade small. Cut losses. Spread across thousands of bets. Underneath, all three are managing the same thing: how big the next loss is allowed to be.
So here is our answer. Win rate is a description of your trading style, not a grade for your trading. It tells you what the ride feels like. Expectancy and size tell you where it ends.
Win rate pays your ego.
Expectancy pays your rent.

Where this fits
The machines are getting faster, and the trader is becoming the bottleneck. This issue shows one exact place where the bottleneck forms: the scoreboard. A machine scores itself in money per decision. A person scores in ticks, and then pays for every tick.
We looked at the same gap from another angle in our previous post, and that’s where the idea that you can fool yourself with a clean looking number came up.
For the story side of why people keep trading these shapes, our sister publication Naked Market has a piece worth your time.
The tool: The Scoreboard Swap
Use it on your next trade, or on the next win rate you see on a poster.
1. What are my average win and average loss in money, and do they include the losers I am still holding? Divide the win by the loss. That ratio is your R, and the rug cannot hide in it.
2. What win rate do I need at that ratio? Work out 1 divided by (1 + R). Win 1 and lose 5 needs 83.3%. If your real win rate is lower, fix that before anything else.
3. How many closed trades is this based on? After 20 trades our losing Trader A was ahead 41% of the time. Wait for hundreds before you trust a number.
4. What is my longest losing streak, and would I still follow my rules through one twice as long? Our 35% trader had a median longest streak of 11.
5. If I change only my stop and target, what happens to the money as well as the win rate? If the win rate swings and the average profit does not, you are turning a dial, not finding an edge. Include your costs.

Before you go
We started this issue thinking win rate was a decent number with some blind spots. We finished thinking of it as the weather report: it tells you how the day will feel, not whether the farm made money.
We are not your financial advisors, and none of this tells you what to buy or sell. It shows you how the machine works. Our simulations are toy models, with fixed payoffs, no gaps and no costs beyond the ones we named. Real markets are messier, ours included.
The machines are getting faster. Our job is to find out where a human still has an edge.
If this made you look at your own screen differently, subscribe, and send it to the friend who posts green screenshots in the group chat.
Thanks for reading Xtin Capital. If this changed how you look at your own trading, forward it to one friend who still trades on gut feel. That is how this grows.
We are not your financial advisors, and nothing here tells you what to buy or sell. It shows you how the machine works.
Keep reading:
1. Gold is falling. But the real story is the algorithm behind the move.
2. The trader is becoming the bottleneck.
3. Every money has an Eraser, today we build a notebook without an eraser.
-More soon
The Xtin Capital Team