InarconsisbyAna Milutinovic·14h agoA week in Superset, a day in MotherDuck DivesI recently built the same kind of dashboard twice, once as custom Apache Superset plugins and once as a MotherDuck Dive. This article…
InData Storytelling CornerbyJohn Loewen, PhD·15h agoHow To Use Cairo’s Truthful Principle On The Hidden Water DivideA Python tutorial using the UN SDG water dataset
Clemence Ayekple·1d agoTurning Analysis Into a Story People Act OnFrom a chart that shows data to a chart that makes a point
InData Storytelling CornerbyJohn Loewen, PhD·1d agoDrowning in Debt: Surging US Healthcare Costs At 26 YearsA Python data tutorial using the 2027 CMS Marketplace dataA response icon1A response icon1
Travis Carlson·1d agoThe Doomsday Clock Has Moved Back Only 8 Times in 79 Years. This Is Why.I made over the Bulletin of the Atomic Scientists’ timeline as an animated data story for #MakeoverMonday, and every move away from…A response icon1A response icon1
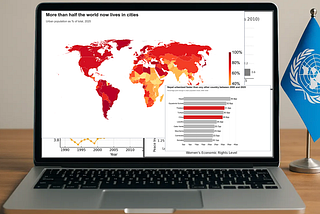
InData Storytelling CornerbyJohn Loewen, PhD·2d agoPython How To: Finding out the Truth on Global UrbanizationA granular approach tutorial with World Bank population dataA response icon1A response icon1
Varyanne Sika·3d agoA Data Visualization of 22 Data Visualizations I’ve MadeA timeline of the first 22 entries in my 100 Days of Data Visualization projectA response icon3A response icon3
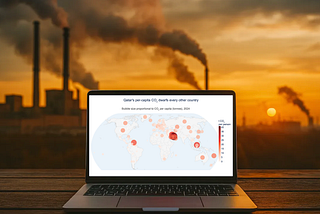
InData Storytelling CornerbyJohn Loewen, PhD·3d agoDirty World CO2 Truths With A Simple Python Bubble MapPlotly tutorial showcasing global per capita CO2 emissions dataA response icon1A response icon1
InData Storytelling CornerbyJohn Loewen, PhD·4d agoHow To See America’s Painful Medicare Coverage Gap With PythonA tutorial using recently released 2027 CMS Marketplace dataA response icon1A response icon1
InData Storytelling CornerbyJohn Loewen, PhD·5d agoTerrific Nudge Theory Tricks To Make Your Python Charts More PowerfulA World Toilet Day tutorial using effective data viz techniquesA response icon1A response icon1