vu manh·4d agoHow a 12MiB/s disk cap made our Loki logs 30 minutes lateFor years, our logs ran late. Every working day from 8:00 to 17:00, a new log line could take up to 30 minutes to show up in Grafana. It…
InAWS TipbyHarshal Jethwa·Oct 20Kubernetes Logging and Monitoring with Grafana, Loki, Promtail & Prometheus (using Kind Cluster)Overview
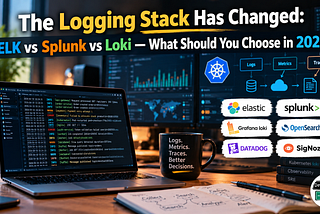
InDevopsCurrybyDevopsCurry (DC)·Oct 6The Logging Stack Has Changed: ELK vs Splunk vs Loki — What Should You Choose in 2026?Few days back, I was chitchatting about observability with a DevOps friend when he randomly asked me :A response icon1A response icon1
Ankur Batham·Sep 25How to Monitor Claude Code Usage Across TeamA simple guide to tracking cost, usage, and productivity with OpenTelemetry, Loki, Prometheus and Grafana
Abhilasha Gupta·Sep 23Logs Are Liars: The Dead Peers That Were Never DeadEvery engineer knows the feeling. A service starts misbehaving, you open the logs, and there it is, a confident, specific accusation…
Wilson Wong·Sep 14One Endpoint, Multiple Services: Why Your Telemetry Needs a CollectorGithub : wilws/observability_template
Muhammadpahrizal·Sep 5How I Built End To End Observability Stack with OpenTelemetry, Prometheus, Grafana, Loki, and…When an application is running, knowing that it is up does not necessarily mean knowing what it is doing.
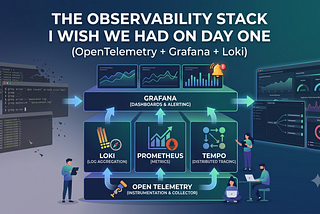
InStackademicbyRonik Dedhia·Aug 30The Observability Stack I Wish We Had on Day One (OpenTelemetry + Grafana + Loki)For the first eighteen months of our product’s life, our observability stack was `console.log`. Not even `console.error`. Just logs printed…
InThe Belladonna ComedybyAmy Greenlee·Aug 18I Watched Pompeii: Out of Time with Tom Hiddleston. Ask Me Anything.Marvel does not yet own the city of Pompeii and its associated ruins