My Vibecoded Server Went Down


On August 3, every site I run went down at once, came back twelve minutes later, and did it again. About twenty-one times, over sixteen hours.
The generated code was never the problem. Everything that failed sat around it, in the defaults I never opened.
Five domains: the marketing site, the dashboard, the API, the login service, and the memory product people actually use. All of them on one 4-vCPU cloud box.
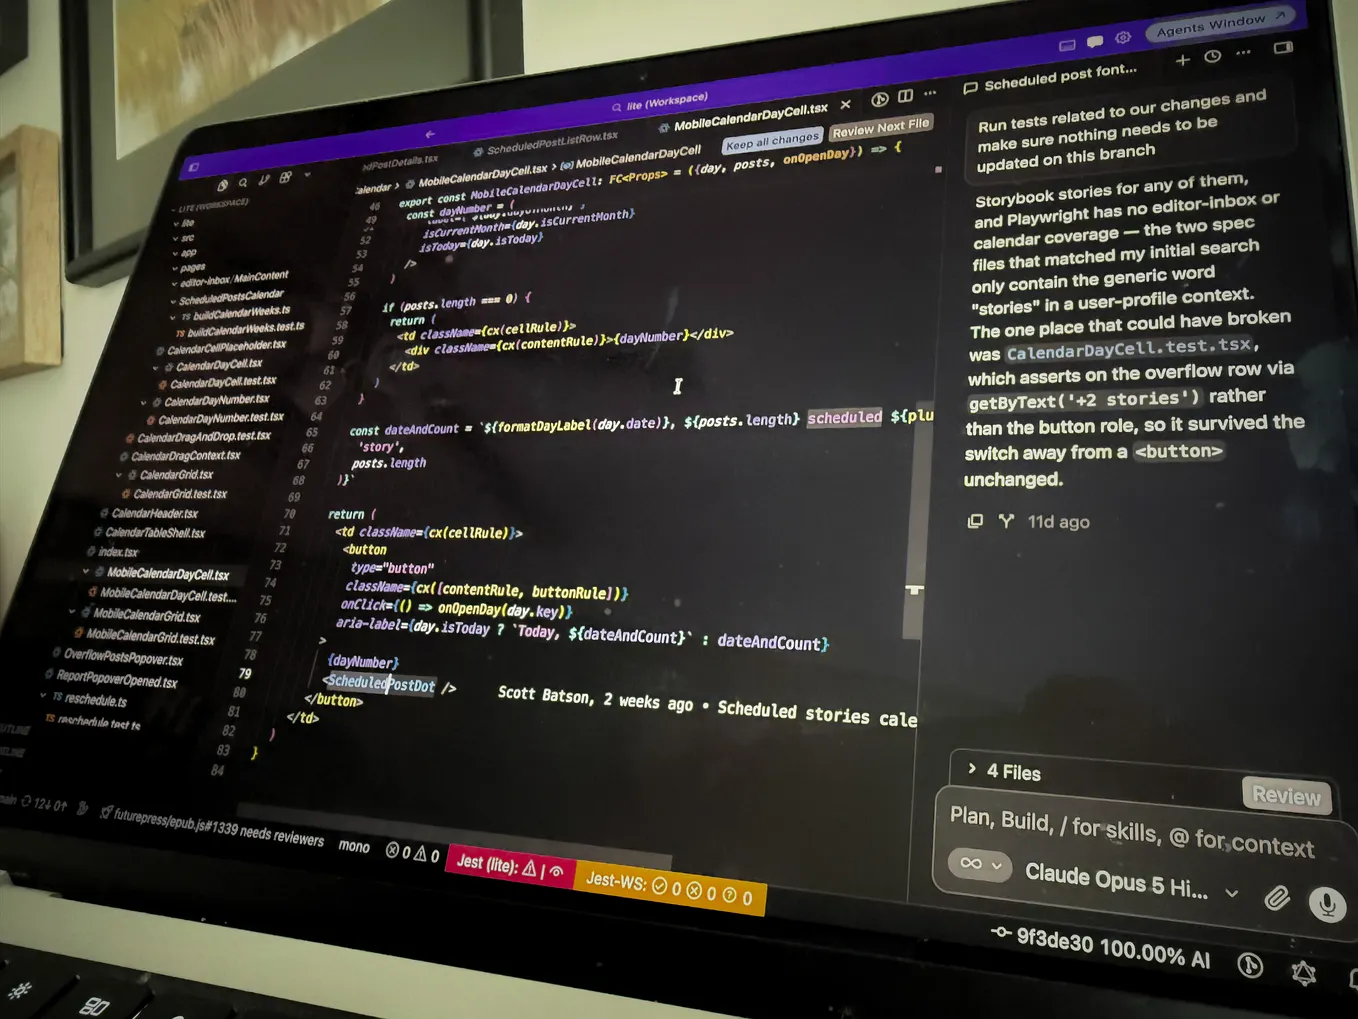
What knocked them over was the least important thing I own: a public directory I built in six weeks of prompting. 203 commits in those six weeks, almost none of them typed by hand.
The audience I built for was 0.4% of my traffic
Six days before the outage I sampled 35 minutes of access logs, because the box felt warm. It held 19,124 requests. Sixty-seven of them came from people.

Two more numbers from that window: 68% of everything hit one page, the browse listing, and a single datacenter address range, all of it wearing ordinary Chrome browser labels, was 60% of the traffic.
I read that, tightened robots.txt, raised one CPU limit, and went back to shipping features. I treated it as a curiosity. It was a forecast.
I raised that limit on the app. The same kind of cap was sitting on the proxy in front of it, and I never looked.
A measurement you file instead of acting on is just a better-documented surprise.
I published an infinite website without noticing: faceted filters as a crawl trap
The directory has six filters: search, category, language, type, license, sort. Ordinary product work.
Six dropdowns are not six pages. Every combination is its own URL, and every URL is its own render:
/mcp/browse?category=Security&language=TypeScript&sort=stars
/mcp/browse?category=Security&language=Python&sort=stars
/mcp/browse?category=Security&language=Python&license=MIT&sort=stars
Three request lines from the access log. Each one is a separate full render.
In that same 35-minute window, the crawlers asked for 13,067 distinct query strings. No two the same, so nothing could ever be served twice from a cache.

It filled the disk, too. Next.js wrote every unique fetch to its own file, about 170 KB each, with no size limit. It reached 54.3 GB and the root disk hit 100% at half past six that morning, a separate fire before the real one.
A filter panel is a URL generator. Mine generated faster than I could serve.
Then I made the pages cheap: covered indexes and a cached render
Under crawl load a filtered page took seven seconds at the median and fifteen at the 90th percentile. Two reasons, both boring, both mine.
The first: MongoDB read the whole collection to return 24 rows. No index covered the filter and the sort together, so matching rows came back and were sorted in memory on every request.
Measured live over 20 seconds, it scanned 7,304 documents per second against only 1,118 index keys per second. More rows scanned than index keys read. That is the whole bug.
Usage counters over 19 hours of real traffic showed which indexes were working and which were decoration:
5,492,032  github.language_1     <- the crawl, then a blocking sort on every hit
      200  popularity_-1__id_1
        0  popularity_-1
        0  github.stars_-1
        0  updatedAt_-1
        0  name_1
        0  npm.downloadsLastMonth_-1
Index hit counts from $indexStats over 19 hours of live traffic.
Four sort indexes, zero uses in 19 hours. They existed as single fields, but the real queries sort by a field plus a tie-breaker, so none could ever be chosen. The repair was one index per filter shape, with the sort keys carried inside it:
const LIST_SORT_TAIL = { popularity: -1, 'github.stars': -1, slug: 1, status: 1 };

await servers.createIndex({
 'github.language': 1,
 ...LIST_SORT_TAIL
}, {
  name: 'list_language'
});
The filter key first, then the sort keys, from packages/crawler/src/mongo.ts.

The second reason: the page was rebuilt from scratch on every request, so crawler volume converted directly into CPU. I split the surface. Pages crawlers are welcome on get rendered once and reused; only genuinely unbounded views stay dynamic.
// bare /mcp/browse and ?page=N: render once, serve from cache
if (!hasFilters) return <CachedBrowse page={page} />;
The render gate in browse/page.tsx. No filters, serve the cached render.
Measured on production afterwards: a cache-miss render fell from the two or three seconds it cost under load to 90-250 ms, and a warm one to 20-30 ms, against a 6 ms backend fetch. The cost was never the data. It was the render.
The cheapest rate limit is a page that costs nothing to serve.
The lock on the front door cost more than the house: RSA-4096 and TLS handshakes
That still left the outage itself, and this part took me all day to see.
Every HTTPS connection begins with the server proving it owns the domain by signing a challenge with its private key. That signature is real arithmetic and real CPU. Your browser pays it once and reuses the result for everything else it loads.
A fleet spread over 7,100 addresses reuses nothing. Every request bought a brand new signature.

My certificate used the largest, slowest key type, RSA-4096, because that is what the ACME client built into Traefik picks when you do not set a key type. Standalone Certbot switched to elliptic curve years ago. The one inside my proxy never did, and I never checked which one I was running.
Traefik, the proxy in front of everything, was allowed six-tenths of one CPU core, a conservative limit I wrote into my own notes months earlier and never reopened.
So the proxy spent its whole budget signing hellos and never reached the part where it reads a request. When I asked the stuck process what it was doing, one line repeated all the way down:
crypto/rsa.SignPSS(...)
crypto/tls.(*serverHandshakeStateTLS13).sendServerCertificate(...)
Two frames from the wedged proxy’s goroutine dump, taken with kill -QUIT.
Not routing. Not the app. Not the database. Doorman work. Which is why every fix I shipped that day did nothing: rate limits, redirects, caches and a second replica all live above a layer that was already full. Scaling out felt like the fix and moved nothing, because nothing was reaching the thing I scaled.
The repair was two settings: an elliptic-curve certificate, where the server-side signature costs about a hundred times less, and the CPU ceiling raised from 0.6 to 2.
Minutes later every domain answered in 19 ms. That evening, during a live crawl wave, the estate served 200s at about 70 ms with the proxy at about 30% CPU. Later the same night the box ran at a load average of 7.99, worse than during any of the morning’s full-down waves, and every request still came back 200.
Get Volodymyr Vreshch’s stories in your inbox
Join Medium for free to get updates from this writer.
Twenty-seven requests a second took down five production sites. The worst burst I measured in the two weeks around it was sixty. Any laptop serves that. It was never the volume. It was the price I had put on every connection, in a setting I did not know I had chosen.
A default you never chose is still a decision you shipped.
One box, one blast radius
A public directory of open-source metadata took down authentication and people’s private memories, because they shared a machine. That is not a capacity problem. It is a placement problem. A second box was a rounding error on the monthly bill. Sixteen hours of five domains down was not.

Four days later a second fleet defeated per-address limits by rotating through 2,500 addresses a minute. The answer was not a bigger box: one cap on how many renders may run at once took the median from 5.2 seconds to 39 ms.
Isolation is the cheapest thing to buy early and the most expensive to retrofit.
I did not block a single crawler: robots.txt and one concurrency cap
The obvious move was a ban list. I had one ready a week earlier, finished and tested, and I threw it away. My own instructions, mid-incident:
“the bot is fine - do not blacklist it”
“also - I WANT TO ALLOW BROWSING - BUT - without filters”
A directory that blocks crawlers is a directory nobody finds. What shipped was a contract instead of a wall:
User-Agent: *
Allow: /
Disallow: /mcp/browse?*q=
Disallow: /mcp/browse?*category=
Disallow: /mcp/browse?*language=
Disallow: /mcp/browse?*license=
Disallow: /mcp/browse?*type=
Disallow: /mcp/browse?*sort=
Crawl-delay: 3
From the shipped robots.txt. Six filter parameters are disallowed, and ten AI crawlers, GPTBot and ClaudeBot and PerplexityBot among them, are named and allowed by name.
Nobody was attacking me. They were reading everything I publish as fast as they could, presumably to feed a model. Deliberate harvesting, accidental denial of service.
You do not blacklist the weather. You build for it.
I could not see it while it was happening: alerting on saturation, not errors
I was not flying blind. Logs existed, and an admin page to read them. What I did not have was anything that could show me the shape of the failure.
The outage’s own signature was absence. The minutes missing from the access log were the outage windows: the proxy stopped accepting connections, so there was nothing to log and nothing to error on.
The tool that finally cracked it was a goroutine dump of a stuck process, not a dashboard.

So the week after went into being able to see:
- SigNoz on a box of my own, August 6
- traces out of every backend, August 7
- log shipping off every container, August 8
- an admin dashboard with HTTP error rates, host alerts, real container CPU and edge request rates, by August 11
The alert rule came out of the outage’s own signature. It alarms on saturation: fifteen-minute load average per core above 80%, because that is how the flood looked from outside.
One honest detail. A note in my own vault, dated August 5, two days after the outage, still lists SigNoz under “skip for now” on cost grounds. It shipped on August 6. A considered decision reversed itself in twenty-four hours, which tells you how considered it was.
An outage that produces no errors is invisible to error monitoring. Mine produced silence.
What I would change before the next one
Vibecoding compressed the writing. It did not touch the operating. Six weeks of prompting produced a working product. The product was never the hard part.
The key type was. The CPU ceiling, the cache with no eviction, the index that could not serve its own sort, and which machine the container landed on.

1. Isolate first, and keep the parts small. Anything public and unpredictable gets its own machine before it gets traffic, and every part is treated as something that will fail.
Many small independent projects beat one large one for the same reason small prompts do: less goes wrong at once, and less goes with it.
2. Decide the defaults you inherited. The one most dangerous to skip. A generated app arrives with a certificate key type, a CPU ceiling, a cache with no eviction policy and a placement, none of which anybody chose. They are still your production decisions.
3. Make the thing cheap before you try to make the traffic small. An index that carries its own sort order and a cached render bought more headroom than a day of throttles, and they keep working when the throttles get bypassed.
4. Buy observability before you need it. Ship logs off the box, trace the calls, and alarm on saturation rather than on errors, because the failures worth catching often produce no errors at all.
I wrote that spend off as too expensive two days after the outage, and shipped it the day after that.
5. Treat every interface you publish as a contract. Every failure in this story is one I shipped without reading it back:
- robots.txt - a contract the other side is free to ignore, and did
- the filter URL space - an infinite API I never meant to publish
- the apex redirect - a second door into the same pages, which my throttle did not cover
- the certificate key type - a cryptographic contract with every client that connects
The one that behaved was the health endpoint. Fixed shape, reviewed once, and it told me the truth at quarter past three in the morning.
Architecture matters more now, not less, because the code stopped being the slow part.
What I still got wrong
My health monitoring had existed since June and had been silently skipping every run for a month before anyone noticed. It had been genuinely working for 19 days when the storm hit.
A check that never runs looks exactly like a check that passes.
There is also still no formal post-mortem in my notes. The placement rules got written down five days later. The incident review never did. This article is it, nine days late.
If you want one thing from my day, run this against anything you serve:
openssl s_client -connect example.com:443 </dev/null 2>/dev/null \
  | openssl x509 -noout -text | grep -A1 "Public Key Algorithm"
Prints the key algorithm, and its size, of the certificate any host is serving.
If that says rsaEncryption at 4096 bits and you chose neither, you are one crawler away from my Monday. Then go and find every resource limit in your stack that you did not personally pick. That list, not your diagram, is your real architecture.
Everything in this article is live, not staged:
- catalog.agentage.io - the directory that fell over, now on its own box
- agentage.io - the memory product that was sharing the machine with it
- vreshch.com - longer write-ups, same receipts
- medium.com/@vreshch - the earlier field reports
About the author
Volodymyr Vreshch builds agentage Memory, a shared memory layer for AI agents, and catalog.agentage.io, an MCP directory indexing 20,000+ servers. He writes about agents, MCP, and developer tooling at vreshch.com. Senior Software Engineer at Microsoft. On GitHub: https://github.com/vreshch