The Silent Conductor: Why Visual Hierarchy Is More Than Just Making Things Bigger

We obsess over font sizes, but the true architecture of attention is built on contrast, space, and cognitive rhythm.
I remember the exact moment I realized our entire design team was fundamentally misunderstanding visual hierarchy. It was not during a heated debate over typography scales. It was not while arguing about the exact hex code of our primary action color. It was a quiet Tuesday afternoon in a glass walled conference room, sitting across from a VP of Product who was staring at our newly redesigned enterprise dashboard.
We had spent three months perfecting this interface. The data visualizations were crisp, the navigation was intuitive, and the layout was mathematically aligned to an eight point grid. We were incredibly proud of the final result.
The VP scrolled through the main reporting view, his brow furrowed. He stopped at a critical section displaying the monthly revenue forecast. He tapped the screen with his pen and looked up at me. He said the most important number on the screen was completely invisible. He asked why we did not just make it bigger.
I looked at the screen. The revenue forecast was indeed the most critical piece of information for his daily decision making. But visually, it was rendered in a lightweight, medium gray font, sitting quietly next to a much smaller, but vibrant, neon blue indicator showing server uptime.
I explained that we had designed the hierarchy based on the user’s primary task flow. The server uptime was an anomaly alert, requiring immediate visual interruption. The revenue forecast was a contextual metric, meant to be read in passing.
The VP shook his head. He said his users did not care about our task flow theory. He said if a number mattered, it needed to be huge. He asked us to double the font size of the revenue forecast and make it bold black.
I felt a familiar knot of frustration tighten in my stomach. This was the fifth time that month a stakeholder had demanded we solve a hierarchy problem by simply increasing the size of an element. We were treating visual hierarchy as a blunt instrument, a shouting match where the loudest voice wins.
Looking back, I realize we were both wrong. The VP was wrong to assume that size equals importance. But I was also wrong to assume that our subtle, nuanced hierarchy was effectively communicating the right story to a user who was stressed, distracted, and looking for a specific number.
We were both trapped in the myth that visual hierarchy is just about making things bigger or smaller. We were ignoring the deep, psychological architecture of human attention. We were ignoring the invisible forces of contrast, spatial grouping, cognitive load, and negative space that actually guide the eye.
This article is a deep exploration of that invisible architecture. We are going to dismantle the primitive reliance on font size. We will examine the neurological mechanics of how the eye actually scans a screen. We will explore the Gestalt principles that dictate how the brain groups information. We will analyze the destructive nature of flat hierarchies and the “everything pops” fallacy. Finally, we will uncover the profound significance of negative space as an active structural tool.
Because the lesson here is not about how to choose a typography scale. The lesson is about how to design a cognitive roadmap that guides the user’s attention exactly where it needs to go, without them ever realizing they are being guided.

The Myth of Size and the Reality of Visual Weight
To understand why simply making things bigger fails, we have to look at how the human visual cortex processes information. Size is the most primitive tool in the hierarchy toolkit. It is the first thing we learn as children. If you want someone to look at something, you make it huge.
But in complex digital interfaces, size is also the most easily exhausted resource. You can only make a headline so big before it breaks the layout. You can only make a button so large before it consumes the entire viewport. When you rely solely on size, you quickly run out of room, and the interface becomes a chaotic landscape of oversized elements screaming for attention.
The solution to this limitation is a concept called visual weight. Visual weight is not just about physical dimensions. It is the perceived importance of an element based on a combination of multiple visual properties.
Visual weight is calculated by the brain using a complex formula that includes size, color, contrast, density, and position. A small element with high contrast and dense visual information can carry significantly more visual weight than a massive element with low contrast and sparse information.
I noticed the destructive power of ignoring visual weight when we were redesigning a financial trading platform. The traders needed to see the overall market trend at a glance. We designed a massive, beautiful line chart that took up the top half of the screen. It was huge. It was impossible to miss.
But the traders hated it. They said it was useless.
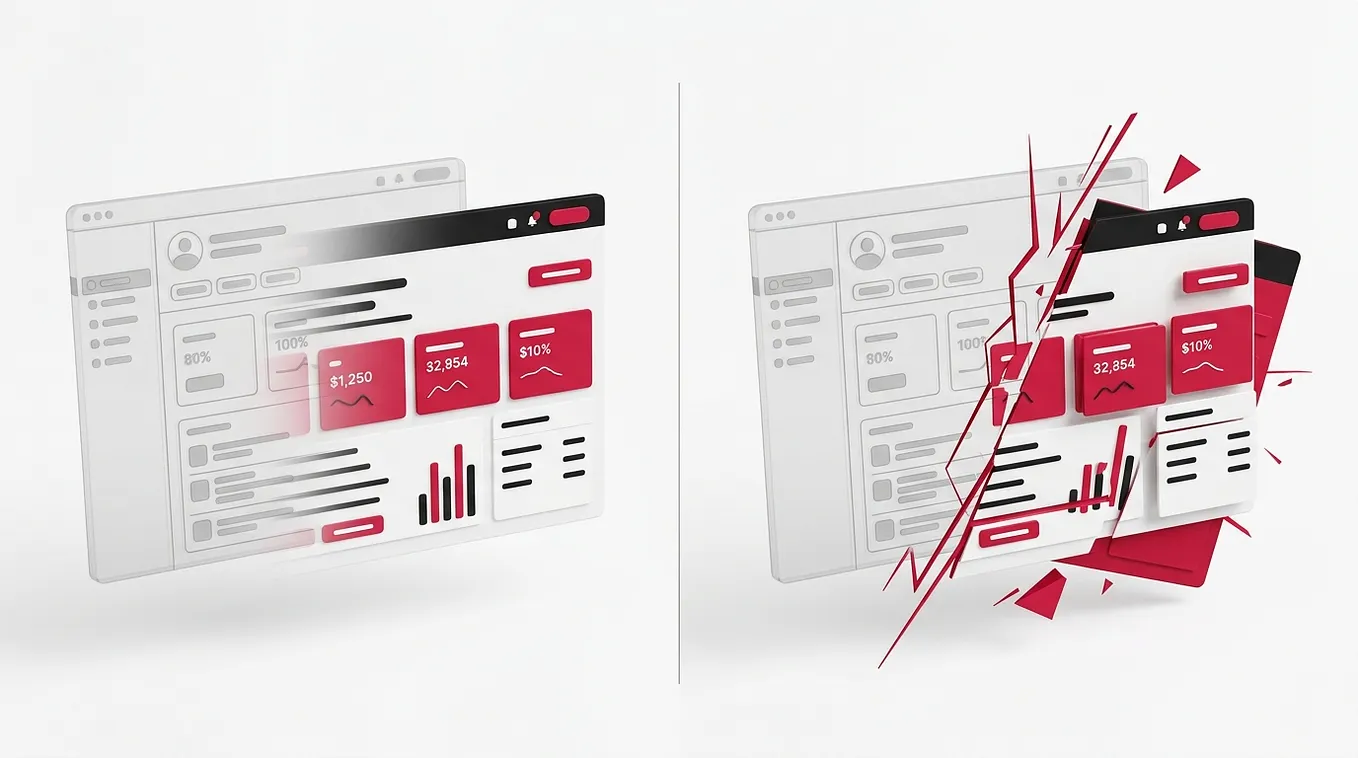
When we sat down to watch them work, we realized the problem. The line chart was rendered in a soft, pastel blue. It was massive, but it had almost zero visual weight because it lacked contrast and density. Meanwhile, the order book on the right side of the screen was a tiny, dense block of red and green numbers. It was physically small, but its high contrast and extreme information density gave it immense visual weight.
The traders’ eyes were constantly pulled away from our beautiful, massive chart and drawn directly to the tiny, dense order book. Our primary element was being ignored because it lacked the visual gravity to hold the user’s attention.
What surprised me most was how deeply ingrained the “bigger is better” bias is in product management. When I showed the stakeholders the eye tracking data proving that the tiny order book was capturing ninety percent of the users’ focus, they still wanted to make the line chart bigger. They could not comprehend that visual weight was overriding physical size.
Most people assume that visual hierarchy is a one dimensional scale of importance. They misunderstand that it is a multi dimensional ecosystem of visual properties. You cannot solve a contrast problem with size. You cannot solve a density problem with color.
One lesson I did not expect was how much the background color affects the visual weight of foreground elements. A dark gray text on a white background has a completely different visual weight than the exact same dark gray text on a deep navy background. The context changes the calculation.
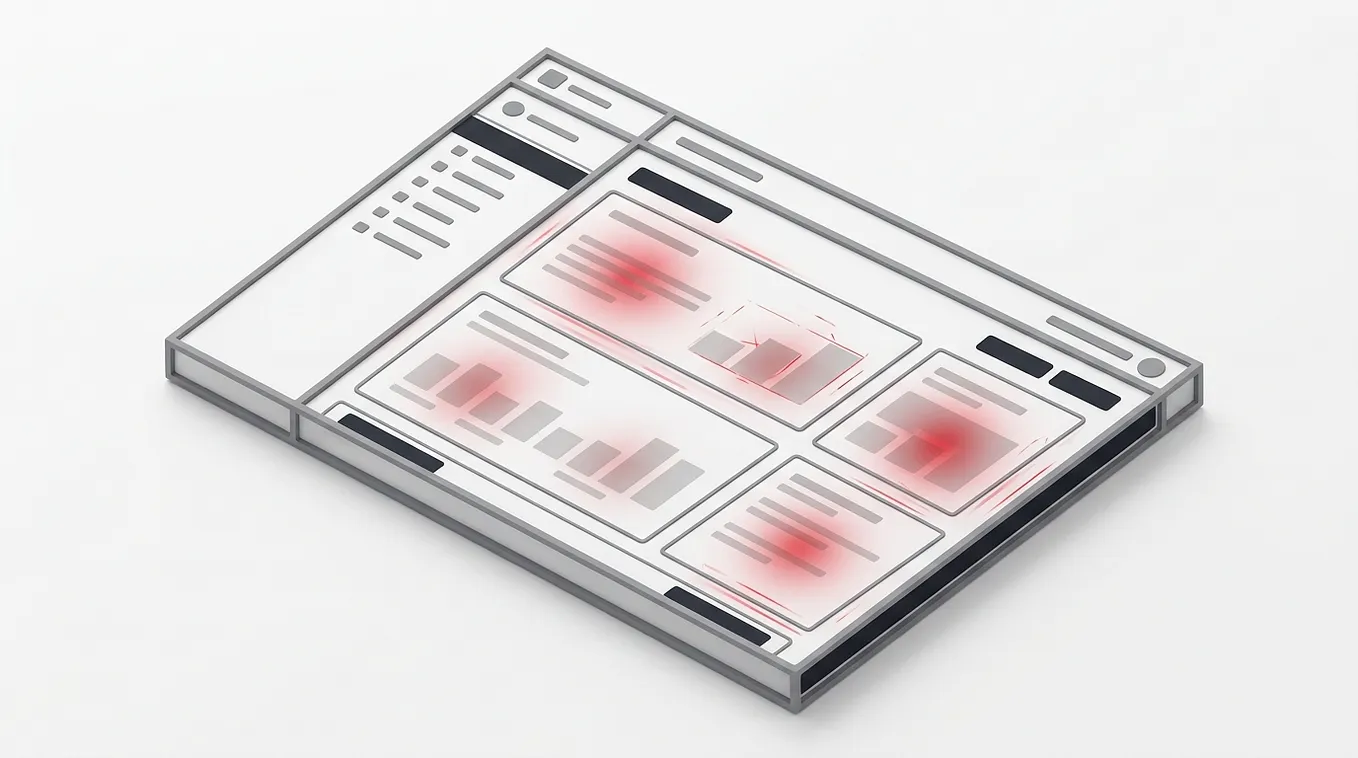
The practical takeaway is to audit your interfaces using a grayscale blur test. Take a screenshot of your design. Convert it to black and white. Apply a heavy Gaussian blur until the text is illegible and only the shapes and tones remain.
Look at the blurred image. Where does your eye go first? If your most important element does not have the darkest tone or the highest contrast in the blurred image, it does not have enough visual weight. It does not matter how big you make the font. If the contrast is wrong, the hierarchy is broken.
When you master visual weight, you stop relying on the blunt instrument of size. You start conducting a symphony of contrast, color, and density. You create an interface where the most important elements naturally pull the eye, regardless of their physical dimensions.
But even with perfect visual weight, the eye needs a roadmap to follow. It needs to understand the sequence of the information.
The Psychology of the Eye: Saccades, Fixations, and the Cognitive Map

We design for the retina, but we must design for the brain’s prediction engine.
When a user looks at a screen, they do not scan every pixel in a smooth, continuous line. The human eye is physically incapable of that. Instead, the eye moves in rapid, jerky jumps called saccades, punctuated by brief moments of stillness called fixations.
During a saccade, the brain is essentially blind. It is only during the fixation, when the eye is perfectly still, that the brain actually processes visual information. Each fixation lasts only a fraction of a second, and the brain can only process a very small area of high resolution vision, known as the fovea, during that time.
This means that when a user looks at your interface, they are not reading it. They are jumping around it, taking tiny, high resolution snapshots, and stitching them together in their working memory to form a complete picture.
I experienced the profound impact of this neurological reality when we were conducting eye tracking research on a complex enterprise data table. The table had fifty columns of data. We assumed users would scan from left to right, reading the row labels, then moving across the columns to find the data they needed.
The eye tracking data told a completely different story.
The users were not scanning left to right. They were jumping directly to the anomalies. Their eyes would fixate on a row label, then immediately saccade across the screen to a cell that was highlighted in red, then jump to a cell with a massive number, then jump to a cell with a warning icon.
They were not reading the table. They were hunting for deviations from the norm. Their brains had built a cognitive map of what a “normal” data table looks like, and they were using their peripheral vision to detect anything that broke that pattern.
What surprised me most was how frustrated the users were when we designed the interface to support a linear reading pattern. We had added subtle zebra striping to the rows to help the eye track across the columns. The users hated it. They said it felt slow and clunky. They did not want to read the table. They wanted to find the problems.
This is the danger of designing for the mechanical movement of the eye rather than the cognitive goals of the brain. The brain does not care about zebra striping. The brain cares about finding threats, identifying opportunities, and confirming expectations.
Most people assume that visual hierarchy is about guiding the eye in a specific physical path. They misunderstand that the eye only follows the brain’s intent. If the brain is looking for an anomaly, no amount of typographic hierarchy will force it to read a perfectly normal row of data first.
Looking back at the data table redesign, I realize how often we force users into unnatural reading patterns. We design beautiful, linear layouts that assume the user has the time and patience to consume information sequentially. But in the real world, users are impatient, distracted, and highly goal oriented. They want to jump straight to the answer.
One lesson I did not expect was the critical role of peripheral vision in this process. Even though the fovea only captures a tiny area of high resolution, the peripheral vision is highly sensitive to motion, contrast, and rough shapes. The peripheral vision acts as a radar system, scanning the environment and directing the saccades toward points of interest.
If your most important elements do not have the right visual weight to trigger the peripheral radar, the user’s eyes will never saccade toward them. They will remain fixated on whatever caught their attention first, even if it is irrelevant.
The practical takeaway is to map the user’s cognitive intent before you map the visual weight. Do not just ask what the most important information is. Ask what the user is trying to achieve when they look at this screen. Are they looking for a specific data point? Are they looking for a status update? Are they looking for an anomaly?
Once you understand the cognitive intent, you can design the visual hierarchy to support it. If they are looking for anomalies, use high contrast and color to make the anomalies trigger the peripheral radar. If they are looking for a specific data point, use clear, consistent alignment and typography to make the scanning process effortless.
When you align the visual hierarchy with the brain’s prediction engine, you stop fighting the user’s natural behavior. You start facilitating their cognitive goals. You create an interface that feels incredibly fast, not because the system is fast, but because the user finds exactly what they need without unnecessary detours.
But once the eye lands on an element, it needs to understand its relationship to the surrounding elements. It needs to know what belongs together and what is separate.
The Gestalt Principles and the Invisible Architecture of Grouping

The brain is a relentless pattern matching machine that refuses to see isolated parts.
When you look at a complex interface, you do not see a hundred individual buttons, text fields, and labels. You see groups, clusters, and sections. This is not a conscious choice. It is an involuntary neurological reflex governed by the Gestalt principles of perception.
The Gestalt principles dictate how the brain organizes visual elements into meaningful wholes. The most critical of these principles for interface design are the laws of proximity, similarity, and continuity.
The law of proximity states that elements that are close together are perceived as a group. The law of similarity states that elements that look alike are perceived as a group. The law of continuity states that the eye follows smooth paths and lines.
These principles are the invisible architecture of visual hierarchy. They do not just tell the user what is important. They tell the user how the information is structured. They define the relationships between the data.
I learned the hard way what happens when you violate the law of proximity. We were designing a complex onboarding form for a healthcare application. The form had dozens of fields. To make the form look clean and modern, the design team decided to use a uniform, generous spacing between every single field. Every label, every input box, and every helper text was separated by exactly twenty four pixels.
It looked beautiful in the design file. It was perfectly aligned. It was mathematically precise.
When we tested it with real nurses, the error rate was catastrophic.
The nurses were constantly entering data into the wrong fields. They would read a label, look down, and type the answer into the input box below it. But because the spacing was uniform, the input box below the label was actually the field for the next question.
Get Edward Flynn’s stories in your inbox
Join Medium for free to get updates from this writer.
The label for “Patient Date of Birth” was separated from its input box by the exact same amount of space as the input box for “Patient Date of Birth” and the label for “Insurance Provider”. The brain, relying on the law of proximity, grouped the label with the wrong input box.
What surprised me most was how fiercely the design team defended the uniform spacing. They argued that it created a clean, rhythmic vertical flow. They believed the users would just read the labels carefully. They were designing for the aesthetics of the grid, completely ignoring the cognitive reality of the user.
This is the destructive power of ignoring the Gestalt principles. When you break the law of proximity, you force the user’s brain to work overtime to figure out the relationships. You introduce cognitive friction at every single step of the interaction.
Most people assume that grouping is achieved through explicit boundaries, like boxes, borders, or background colors. They misunderstand that the brain prefers implicit grouping. Explicit boundaries add visual noise and increase cognitive load. Implicit grouping, achieved through the careful manipulation of whitespace, is invisible and effortless.
Looking back at the healthcare form disaster, I realize how often we prioritize visual symmetry over cognitive logic. We want the grid to look perfect, so we force the content into a rigid structure that makes no sense to the user. We sacrifice usability on the altar of aesthetics.
One lesson I did not expect was the profound impact of micro whitespace versus macro whitespace. Micro whitespace is the small gaps between a label and its input, or between lines of text in a paragraph. Macro whitespace is the large gaps between distinct sections of the page.
If you get the micro whitespace wrong, the user cannot parse the individual elements. If you get the macro whitespace wrong, the user cannot understand the overall structure of the page. Both are critical for establishing a clear hierarchy.
The practical takeaway is to use the squint test to verify your grouping. Open your design file. Step back from your monitor. Squint your eyes until the screen becomes blurry.
Look at the blurred shapes. Can you clearly see the distinct groups of information? Are the related elements huddled closely together? Are the separate sections clearly divided by larger gaps of negative space? If the blurred shapes look like a single, uniform blob, your proximity hierarchy is broken.
When you master the Gestalt principles, you stop relying on explicit borders and heavy background colors to organize your interface. You start using the invisible force of whitespace to create implicit, effortless relationships. You create an interface that the brain can parse instantly, without conscious effort.
But what happens when everything is grouped perfectly, yet nothing stands out? What happens when the hierarchy is so flat that the user cannot find the next step?
The Cognitive Load of Flat Hierarchies and the “Everything Pops” Fallacy

When everything is important, nothing is important.
This is the fundamental paradox of emphasis. In an effort to be helpful, product teams often try to make every action prominent. They want to ensure the user does not miss any critical features. So they make every button bold. They make every call to action vibrant. They make every section header massive.
The result is a flat hierarchy. A flat hierarchy is an interface where every element has the same visual weight. There are no clear primary actions. There are no clear secondary actions. Everything is screaming at the exact same volume.
I experienced the devastating impact of a flat hierarchy when we were redesigning the settings page for a complex SaaS application. The product managers were terrified that users would not discover all the new configuration options we had built.
To ensure maximum discoverability, they requested that every single action button on the settings page be styled as a primary action. Every button was filled with the brand blue. Every button had bold white text. Every button had the exact same size and visual weight.
When we launched the new settings page, the support tickets skyrocketed. Users were confused. They were clicking the wrong buttons. They were accidentally changing critical system configurations because they could not distinguish between a “Save” button and a “Delete Account” button. Both were bright blue. Both were bold. Both were screaming for attention.
The users reported that the page felt overwhelming. They felt anxious about clicking anything because they could not tell which actions were safe and which were destructive.
What surprised me most was the psychological toll of this flat hierarchy. It was not just a usability issue. It was a cognitive load issue. When every element has the same visual weight, the user’s brain cannot use visual cues to prioritize. The brain is forced to read every single label, evaluate every single action, and make a conscious decision about what to do next.
This is the “everything pops” fallacy. We believe that by making everything prominent, we are making everything accessible. In reality, we are paralyzing the user with decision fatigue.
Most people assume that users want all their options presented equally. They misunderstand the cognitive limits of the human brain. The brain craves structure. It craves a clear path forward. When you present a flat hierarchy, you force the user to build the structure themselves, which is an exhausting and frustrating experience.
Looking back at the settings page disaster, I realize how often we confuse discoverability with visual prominence. We think that if a button is bright and bold, the user will find it. But discoverability is about information architecture and clear labeling, not just visual shouting.
One lesson I did not expect was the importance of visual quietness. To make a primary action truly pop, you must create a visual vacuum around it. You must relegate the secondary actions to the background. You must use subtle colors, lightweight fonts, and minimal borders for the things that are less important.
Hierarchy requires sacrifice. You cannot have a peak without a valley. If you want the user to instantly recognize the primary action, you must make the secondary actions visually recede. You must give the primary action the space and the contrast it needs to dominate the visual field.
The practical takeaway is to enforce a strict limit on primary actions. Audit your screens and count the number of primary, filled, high contrast buttons in the viewport. There should only be one.
If you have two primary actions, you have a decision problem, not a design problem. You need to rethink the workflow. If you have three or four, you have a flat hierarchy. You must immediately downgrade the secondary actions to ghost buttons, text links, or subtle outlines.
When you embrace the sacrifice of visual weight, you stop creating chaotic, overwhelming interfaces. You start creating clear, confident, and directed experiences. You guide the user’s attention to the exact right place, and you give them the cognitive breathing room to make the right decision.
But if we must relegate secondary elements to the background to make the primary element pop, where do those secondary elements go? How do we prevent the interface from feeling empty or broken?
Designing for the Peripheral: The Power of Negative Space

Whitespace is not an empty canvas. It is an active structural element.
For decades, the design industry treated negative space as a luxury. We believed that screen real estate was expensive, and we needed to fill every single pixel with content, features, and information. We viewed whitespace as wasted space, a void that needed to be filled with value.
This is a profound misunderstanding of visual hierarchy. Negative space is not the absence of content. It is the presence of focus. It is the structural glue that holds the hierarchy together.
Whitespace serves two critical functions in visual hierarchy. First, it provides breathing room for the elements themselves, reducing cognitive load and making the interface feel calm and approachable. Second, and more importantly, it acts as an isolation mechanism. It separates elements from their surroundings, increasing their visual weight and drawing the eye directly to them.
I learned the profound impact of negative space when we were working on a rebrand for a luxury financial advisory firm. The client wanted their new digital dashboard to feel premium, exclusive, and trustworthy.
The initial designs from the product team were dense, data heavy, and packed with features. They looked like standard enterprise software. The client hated them. They said the interface felt cheap and cluttered.
I decided to run an experiment. I took the most critical screen, the portfolio overview, and I deleted half the content. I removed the secondary charts. I removed the news feed. I removed the quick action buttons.
Then, I took the remaining primary elements and I doubled the whitespace around them. I increased the margins. I expanded the padding. I pushed the elements away from the edges of the screen.
The result was breathtaking.
The screen looked completely different. It felt calm, confident, and incredibly premium. The primary portfolio value, rendered in a large, elegant serif font, sat in the center of a vast expanse of pure white space. It demanded attention not because it was shouting, but because it had nowhere else to compete.
What surprised me most was the client’s reaction. They did not complain about the missing features. They did not ask us to add the content back. They said the interface finally felt like a luxury product. They said it felt like it respected their time and their wealth.
This is the paradox of negative space. By removing content, we increased the perceived value of the remaining content. By adding emptiness, we created focus.
Most people assume that negative space is just an aesthetic choice, a way to make the design look clean and modern. They misunderstand that negative space is a functional tool for managing attention. It is the visual equivalent of a pause in a musical composition. Without the pauses, the music is just noise. Without the negative space, the interface is just visual noise.
Looking back at the luxury dashboard project, I realize how often we let business requirements dictate the density of our interfaces. We are terrified of leaving space empty because we feel like we are not delivering enough value. We cram features into every corner, creating a claustrophobic experience that exhausts the user.
One lesson I did not expect was the relationship between negative space and perceived performance. Interfaces with generous negative space actually feel faster to users. The brain can parse the layout instantly because there is less visual noise to process. The eye jumps directly to the isolated elements. The cognitive load drops, and the entire experience feels lighter and more responsive.
The practical takeaway is to treat negative space as a primary design material, not an afterthought. When you are designing a layout, do not just place the elements and then fill the gaps. Start with the negative space. Define the margins, the gutters, and the padding first. Build the structure of the emptiness, and then place the content within that structure.
Increase the padding around your most critical elements by twenty percent. Give your primary call to action a massive margin of breathing room. Isolate your most important data points in vast expanses of whitespace.
When you master the power of negative space, you stop treating the screen as a container to be filled. You start treating it as a canvas to be composed. You create an interface where the hierarchy is not just communicated through color and size, but through the profound, structural silence of the spaces between the elements.
Reconnecting to the Beginning
Let us go back to that quiet Tuesday afternoon in the glass walled conference room.
The VP of Product was staring at the enterprise dashboard. He was tapping the screen with his pen. He was frustrated that the most important number, the revenue forecast, was invisible. He asked why we did not just make it bigger.
If I could go back to that moment, I would not have just argued about task flow theory. I would not have defended the subtle, nuanced hierarchy that was failing to communicate the right story.
I would have opened the design file. I would have applied a grayscale blur test. I would have shown him that the revenue forecast lacked the visual weight to compete with the high contrast server uptime indicator.
I would have explained that we did not need to make the font bigger. We needed to increase the contrast. We needed to adjust the visual weight. We needed to use negative space to isolate the revenue forecast and give it the cognitive breathing room it deserved.
I would have shown him that visual hierarchy is not a blunt instrument. It is a silent conductor, guiding the user’s attention through a complex symphony of contrast, grouping, cognitive intent, and space.
The journey from treating visual hierarchy as a simple matter of font size to understanding the deep, psychological architecture of attention is not easy. It requires a fundamental shift in how we view the user’s experience.
We have to stop obsessing over the physical dimensions of our elements and start obsessing over their visual weight. We have to stop designing for the mechanical movement of the eye and start designing for the cognitive goals of the brain. We have to stop relying on explicit borders and start mastering the invisible architecture of the Gestalt principles. We have to stop falling for the “everything pops” fallacy and start embracing the sacrifice of visual quietness. And we have to stop fearing negative space and start wielding it as our most profound structural tool.
The next time a stakeholder asks you to make something bigger, do not just increase the font size. Pause. Look at the screen. Ask yourself what is really missing. Is it contrast? Is it proximity? Is it isolation? Is it negative space?
Because in the end, the most effective visual hierarchy is the one the user never notices. It does not demand attention. It does not shout. It simply guides the eye, effortlessly and invisibly, exactly where it needs to go.
If you were to audit the most critical screen in your current product using only a grayscale blur test, what essential element would disappear into the background, and how would you rebuild its visual weight without simply increasing its size?