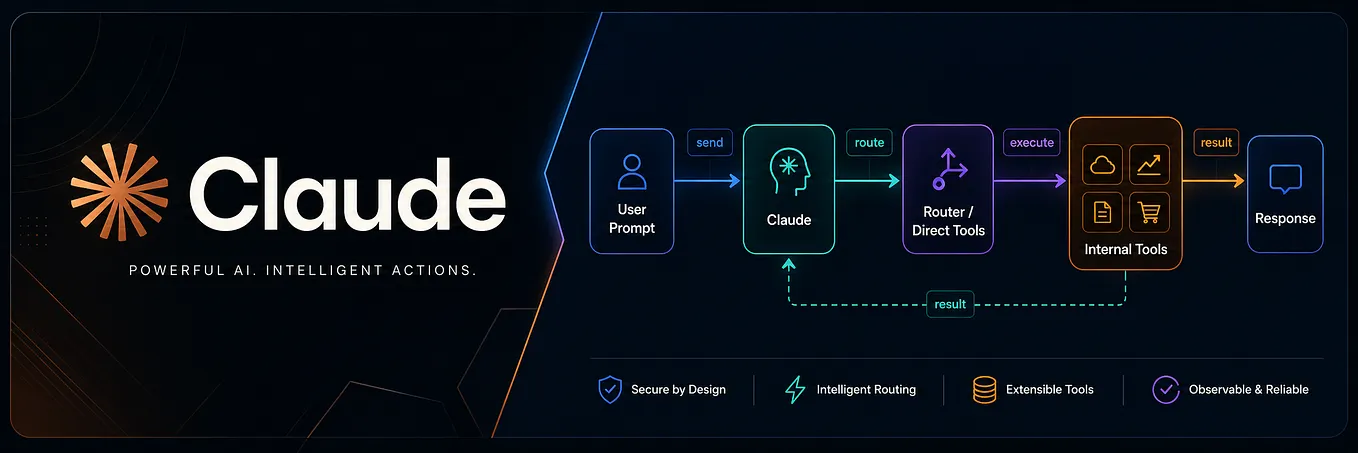
Visual Trace for Claude Code.
Visual Trace is a local observability dashboard for Claude Code: prompts, tool calls, file changes, failures, subagents, and token usage — searchable on your own machine.

TL;DR — Claude Code already emits the signals. The missing piece is a local interface that turns those signals into a usable debugging workflow. Visual Trace is a local dashboard that turns every prompt, tool call, file change, subagent, failure, and token into something you can browse, search, and ask questions about — with a local AI that reads your own runs. No cloud. No telemetry. [Repo at the bottom.](#how-to-try-it)
The moment I realized I was flying blind
I was three weeks into building an agent.
Not a toy. A real one — it pulled data from a few sources, made decisions, kicked off trades in a sandbox, and generally did the kind of work a junior analyst would have done on a Tuesday. Claude Code was the driver. I’d wire up new tools, give it a prompt, and off it went.
And then something weird happened.
I asked it to do the same task twice in a row. Once it worked. Once it didn’t. Same prompt. Same files. Same MCP servers. And I had absolutely no way to answer the question every engineer hates being asked:
”What changed?”
I scrolled the terminal. I opened the transcript file. I squinted at JSON. I tried to remember which tool was called first. I tried to remember if I had seen that permission prompt. I could feel the answer was in there somewhere — the agent had done something different — but there was no rewind button.
That night I checked my Anthropic billing. I had spent more than I thought. I couldn’t tell you which prompt cost what. I couldn’t tell you which run was the expensive one. I could tell you the total. That was it.
This is the part of working with agents nobody puts in the demo video.

The baseline: prompt → tool loop → transcript → terminal. No structured record, no search, no history, no token breakdown.
The thing nobody tells you about agents
When you ship a normal backend, you get observability for free. Logs, traces, metrics, a dashboard, an alert when p99 latency spikes. You’ve had these since forever.
With an agent, you get… a terminal scrollback. Maybe a `.jsonl` file if you’re lucky. Maybe a billing page that updates tomorrow.
And the things you actually want to know are:
- Which prompt did I submit, and what did the agent actually do in response?
- Which tool was called, with what input, and what output?
- When it took a weird turn — which step was the weird one?
- Did that MCP server I just wired up actually fire, or did the agent ignore it?
- I tweaked the system prompt — is it cheaper now, or more expensive?
- When a subagent branched off, what did *it* do?
- When the run failed, where exactly did it fail, and what was the error?
- How much did this specific decision cost me in tokens?
None of this is visible by default. Not because Claude Code is missing features — it has hooks for all of this. The missing piece is a local interface that turns those signals into a usable debugging workflow.
That’s what Visual Trace is. It runs entirely on your laptop, and this article is about what it does and why you might want it.

Same flow, with hooks feeding a local trace server: SQLite as source of truth, Postgres + pgvector for search, Ollama for local embeddings and chat.
What it actually shows you
Open the dashboard at `localhost:3000`. You see a list of sessions — one session is one long Claude Code conversation, the kind where you prompt, it works, you prompt again, it works again, for an hour.
Click into a session. Now you see runs — one per prompt you typed. Each run is titled with the prompt itself. So your list reads like real work:
- fix the login redirect bug
- /review
- add pagination to the dashboard
- what’s taking so long in the ingest route?
Not `run_abc123` or `session-2026–05–04–19–12–03`. The thing you asked.
Click a run. Now you can see, in four different views:
The graph
Every step the agent took, as a node. Tool calls branch out. Subagents branch off into their own sub-graph. Failed steps turn red. Click a node and you see its inputs, its outputs, its duration, and — if it failed — the actual error message, parsed out of whatever nested structure the tool put it in.

Caption: “One run, every step, every tool — click a node to see exactly what it did.”
The timeline
The same story, chronological. Good for *”what happened around 3:14 PM when I think it went sideways.”*

Caption: “Every event in order, grouped into steps, with shortened paths and a copy button on everything.”
The files tab
Every file the agent touched, grouped by which step touched it, with diff previews and a copy button. No more *”which files did that refactor actually change?”*

The tools tab
Every tool invocation, counts, failure rates. Did `Bash` get called 40 times when you thought it would be 3? You’ll see it.

And across all of it, **tokens**. Input, output, cache-read, cache-write, broken out per run and per step. Not estimates. Parsed from the actual transcript. You can see which prompt cost you what, which step in a run was the expensive one, and whether the prompt-engineering change you made yesterday made things cheaper or not.

*On `Stop` / `SessionEnd` the transcript JSONL is parsed, per-request usage rows are written, and each row is attributed to a run by timestamp. These are real numbers, not estimates.*
The small feature that changes the workflow
The simplest feature is also one of the most useful: every run is named after the prompt that created it.
Sounds dumb. It isn’t.
When you’re iterating on an agent, you run the same kind of prompt over and over — sometimes with small tweaks, sometimes big. Before Visual Trace I’d scroll through a list of `run_xyz123` IDs and have no idea which one was the version where I’d told it to use the new tool. I’d re-run things I’d already run. I’d compare the wrong runs.
Now the list reads like my own history, because it is my own history. I can find ”the one where I told it to skip the refactor” in three seconds.
Get touqeer shah’s stories in your inbox
Join Medium for free to get updates from this writer.
Small feature. Huge quality of life.
The scenario I built this for
Picture this: you’re wiring a new MCP server into Claude Code. A custom one. Maybe it fetches market data, maybe it hits an internal API. You’ve written five tools. You give the agent a task that *should* use them.
Before Visual Trace, the “did it work?” loop looks like:
- Submit prompt.
- Wait.
- Read the terminal output, which is mostly the agent’s summary.
- Try to guess whether your tool actually got called.
- Check the transcript file, which is 4 MB of JSON.
- Give up. Add `console.log` to the MCP server. Ship it again.
After Visual Trace:
- Submit prompt.
- Open the run in the dashboard.
- See the exact tool name in the graph. Click it. See the input the agent sent. See the output your MCP server returned. See the duration. See whether the agent actually *used* the result or ignored it.
- Iterate.
The difference between those two loops is the difference between a good afternoon and a bad week.
The same story applies to hooks. You write a new hook. You want to know: did it fire? What payload did it see? Did it slow anything down? Visual Trace captures every hook payload to a debug log *and* shows the effect in the dashboard. No guessing.
The thing that bit me most: tokens you didn’t see coming
Agents do a lot of thinking between tool calls. Every round of thinking is tokens. Every tool result fed back to the model is tokens. Every piece of context loaded via a hook is tokens.
With a normal chat app you feel this in your bill a week later. With an agent it compounds *fast*, because the feedback loop is tight — the agent does something, sees the result, thinks, does something else.
Visual Trace parses your Anthropic transcripts and attributes exact token counts per run and — where it can — per step. On the home page there’s a month-to-date panel: input / output / cache-read / cache-write, broken out, updated live.
The first time I saw it I realized half my cost was cache-write on runs I thought were simple. I rewrote the system prompt to lean harder on the cache. Bill went down 40% the next week. I would never have found that without looking.

Caption: “Input / output / cache-read / cache-write, broken out. Not estimates — parsed from your actual transcripts.”
An AI assistant that can actually read your runs
There’s a sparkle icon in the corner of the dashboard. Click it. It’s a chat.
But the chat isn’t powered by the cloud — it runs against a local model via Ollama, and it’s wired to eight read-only tools that query your own trace database. Things like list_steps, get_step_details, list_failures, search_snippets.
So you can ask:
- ”What was the slowest step in the last run?”
- ”Which files did the refactor run touch under `src/components`?”
- ”Show me every time the agent called the Bash tool with a `rm` command.”
- ”Why did the run at 2:47 PM fail?”
And it actually looks. You watch it call the tools one by one, see the intermediate results, and then get a grounded answer with **clickable citations** that deep-link into the graph, files tab, or timeline.
It is, honestly, the feature I didn’t know I needed. Reading thousands of events yourself is terrible. Asking a local model to read them and summarize is great.

Caption: “Ask a local model about your own runs. It calls read-only tools against your trace DB and answers with clickable citations.”
Everything is local. None of it leaves your machine.
This matters more than it sounds. If you’re using Claude Code to touch proprietary codebases, customer data, internal APIs, or anything sensitive — you really don’t want the observability tool for *that* to be a SaaS you’re piping telemetry into.
Visual Trace keeps:
- Your traces in a local SQLite file you can back up like any other file.
- Your semantic search index in a local Postgres with pgvector.
- Your embedding model and chat model in local Ollama.
The only outbound network calls are the ones Claude Code was already making to Anthropic. Nothing else.
You can delete a session and it cascades cleanly through every table and the vector index. You can wipe everything with one command before recording a demo. It’s your data. It lives on your disk.
Who this is for
- You’re building an agent and need to see what it does before you ship it.
- You’re wiring new MCP servers or hooks and want a real feedback loop instead of a `console.log` rodeo.
- You want to know which prompts are expensive before the bill arrives.
- You want to reproduce a weird behavior instead of shrugging.
- You want your team to review ”what did the agent actually do” the same way you review PRs.
- You want a record. A history. A place to go back to.
If you’ve shipped an agent and you’re at peace with how much you can see — great, skip this. If you’ve felt even a flicker of ”I don’t actually know what just happened” — this is for you.
How to try it
It’s open source. The flow is:
- Clone the repo.
- Run `./setup.sh` (it bootstraps Postgres + pgvector via Docker, pulls the local Ollama models, and installs the Claude Code hooks).
- Paste the printed `settings.json` block into `~/.claude/settings.json`.
- Use Claude Code as normal. Runs appear at `localhost:3000` as they happen.
The README has the full install path, the architecture diagrams, the API reference, and a troubleshooting table for when things don’t go smoothly. This article was the why. The README is the how.
I built this because I was tired of working with an agent I couldn’t see. If you’ve felt that, I hope you find it useful. If you have ideas for what else an observability tool for agents should show — I want to hear them. This is the beginning, not the end.
Agents are going to do more and more on our behalf. The least we can ask is that we get to watch.
https://github.com/touqeerShah/visual-thought-dashboard-claude
Visual Trace is open source. Runs locally. No cloud, no telemetry.
If this resonated, a 👏 helps it find more agent builders. Follow for the next piece on what local agent observability should look like in 2026.