InAxonect BlogbyChathurika Nivanthi·Oct 9Observability-Driven Testing: Redefining Quality Engineering in Modern SystemsAs companies rush into digital transformation processes, software is increasingly becoming more complicated due to the adoption of…
Architecting for Observability·Sep 17Observability Pipelines: Inspect log payloads to prepare processing for production pipelinesBefore configuring Observability Pipelines processors, you need to know exactly what your agents send on the wire. The payload structure…
InKloudMatebyVasavi·Sep 9Dashboards That Explain ThemselvesThe Text Panel puts runbooks, incident context, and post-mortems directly on the dashboard, wired to the exact queries powering your charts
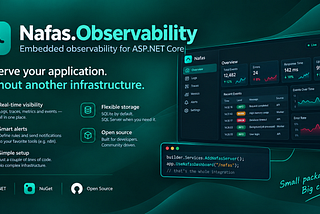
Hadi Jami·Sep 8A Simple Way to See the Hidden Side of Your ApplicationHow can we see what is happening inside an application without adding another complex infrastructure?
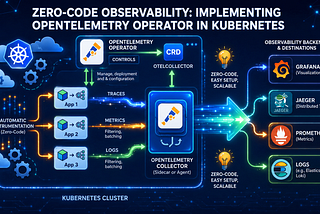
somu·Jul 21Zero-Code Observability: Implementing OpenTelemetry Operator in KubernetesGetting application developers to add telemetry code, manage SDK updates, and manually instrument every endpoint is a classic platform…
Stefanpopov·Jun 29Observability with Grafana, Loki, Prometheus, Tempo and Alloy: Building a Complete Local Stack for…Modern software systems are no longer simple programs running on a single server. They are distributed systems: frontend applications…
touqeer shah·May 5Visual Trace for Claude Code.Visual Trace is a local observability dashboard for Claude Code: prompts, tool calls, file changes, failures, subagents, and token usage —…
CubeAPM·Apr 22CubeAPM: A Modern Datadog Alternative for Cost, Control, and Scalable ObservabilityDisclaimer: This post was originally published on cubeapm.com
dusanstanojeviccs·Apr 9I Was Wrong: OpenTelemetry is Great, the ecosystem around it is the problemThe OpenTelemetry protocol is excellent. The ecosystem that grew around it still has a way to go.A response icon1A response icon1